Download presentation
Presentation is loading. Please wait.

1
Analisis Non-Parametrik Antonius NW Pratama MK Metodologi Penelitian Bagian Farmasi Klinik dan Komunitas Fakultas Farmasi Universitas Jember

2
Reference Bolton, S., Bon, C., 2004, Pharmaceutical Statistics Practical and Clinical Applications, 4th ed, New York: Marcel Dekker, Inc.

3
Outline The probability distribution – Binomial and normal distribution Normality assessment Non-parametric tests

4
Probability Distribution “A probability distribution is a mathematical representation (function) of the probabilities associated with the values of a random variable.” – For discrete, discontinuous, binary data: the binomial probability distribution – For continuous data: the normal distribution
 of the probabilities associated with the values of a random variable. – For discrete, discontinuous, binary data: the binomial probability distribution – For continuous data: the normal distribution")
5
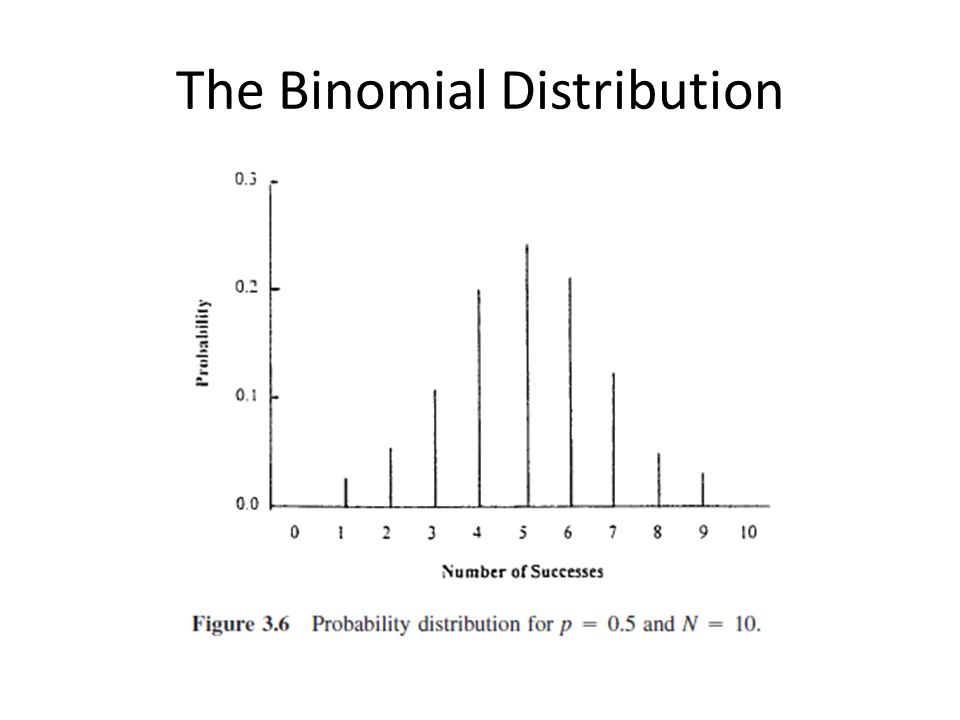
The Binomial Distribution

6
Two parameters: – the probability of one or the other outcome, – the number of trials or observations, N The probability of the outcome of a binomial experiment consisting of N trials: (p+q) N » p: the probability of success » q: the probability of failure
 N » p: the probability of success » q: the probability of failure")
7
The Binomial Distribution Three coin tosses possible results: N+1=4 – Three heads – Two heads and one tail – Two tails and one head – Three tails

8
The Binomial Distribution

10
Three patients receiving antibiotics possible results: N+1=4 1.Three cures 2.Two cures and one failure 3.Two failures and one cure 4.Three failures

11
The Binomial Distribution Four patients receiving antibiotics, p=0.75, q=.25

12
The Binomial Distribution

14
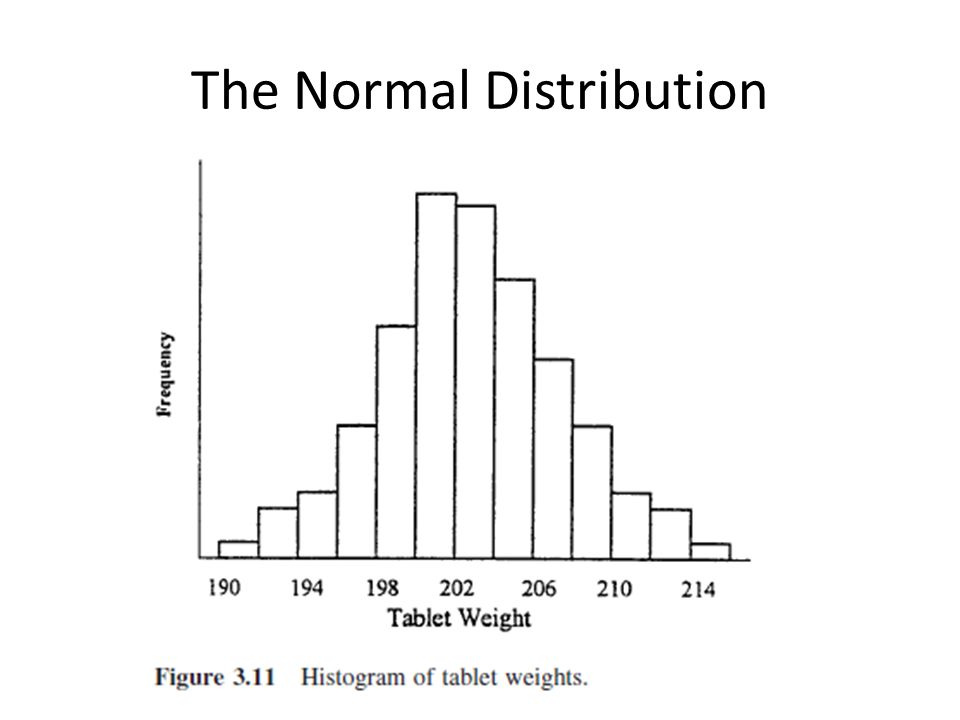
The Normal Distribution A continuous probability distribution and consists of an infinite number of values. Scientific data from pharmaceutical experiments cannot possibly fit this definition. Nevertheless, if real data conform reasonably well with the theoretical definition of the normal curve, adequate approximations, if not very accurate estimates of probability, can be computed based on normal curve theory.

15
The Normal Distribution

19
The Normal Distribution standard normal curve, standard score of Z Z: the number of SDs from the mean

20
The Normal Distribution standard normal curve, standard score of Z Transformation of a value to a standard score (standardizing):
:")
21
The Normal Distribution standard normal curve, standard score of Z

23
Other Common Probability Distributions The Poisson distribution The Student’s t distribution The chi-square (X 2 ) distribution The F distribution
 distribution The F distribution")
25
Assessing normality 2 ways: with statistical tests or without Without statistical test: – In a statistical package, such as SPSS, look at: Histogram symmetric: good Box plot symmetric: good, outliers? Normal Q-Q plot straight line: good Skewness within -1 to 1, close to zero: good Kurtosis within -1 to 1, close to zero: good (in STATA: normal value is 3) Good results: normally distributed data parametric tests. Give examples!
 Good results: normally distributed data parametric tests. Give examples!.")
26
Data not normally distributed? Do transformation to achieve Normality! – natural logarithm i.e. ln(X ) – square root i.e. √X – reciprocal i.e. 1/X – square i.e. X 2 Transforming the data is merely a change of units, like converting pounds to kilograms Assess its normality again! Bad results? Use non-parametric tests
 – square root i.e. √X – reciprocal i.e. 1/X – square i.e. X 2 Transforming the data is merely a change of units, like converting pounds to kilograms Assess its normality again. Bad results. Use non-parametric tests.")
27
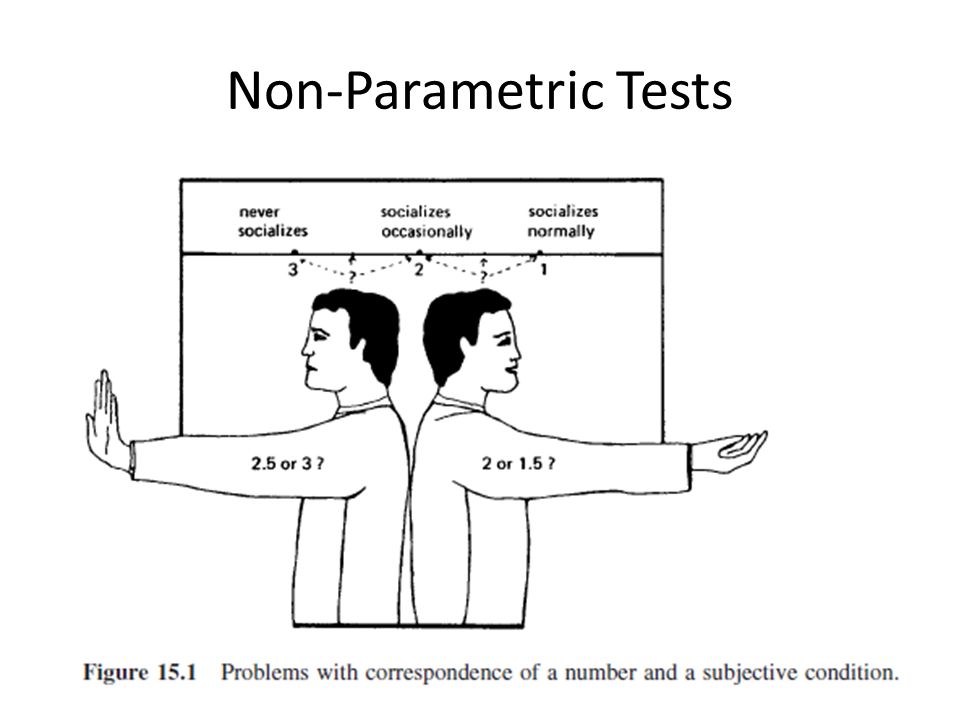
Non-Parametric Tests Distribution-free statistics Remember data types: nominal, ordinal, interval (no true zero), ratio Most efficient for nominal or ordinal (ranked) data Appropriate for continuous data not normally distributed
, ratio Most efficient for nominal or ordinal (ranked) data Appropriate for continuous data not normally distributed")
28
Non-Parametric Tests However, non-parametric tests can be applied to most of the data that we usually encounter, including that from continuous data distributions. Hence, data that are normally distributed may also be analyzed using these methods. – Disadvantage: less sensitive

29
Non-Parametric Tests

31
Basically, converting data into ranks Sign test, the paired t-test alternative Mann-Whitney test, alternative to the two sample t-test Wilcoxon paired samples test, a substitute for the paired t-test Kruskal-Wallis test, alternative to the one-way ANOVA Spearman’s rho rank-sum correlation, a substitute for Pearson’s coefficient correlation

32
Sign Test Probably the simplest The sign test is a test of the equality of the medians of two comparative groups. Paired data The pairs are matched, and differences of the measurements for each pair tabulated. Ties (zero difference) are not counted.
 are not counted..")
33
Sign Test

34
Wilcoxon Signed Rank Test More powerful than sign test as it takes the magnitude of the differences into consideration Ties, again, are not counted.

35
Wilcoxon Signed Rank Test

37
Wilcoxon rank sum test (Mann-Whitney U-test) Alternative to the two independent sample t- test What is the meaning of “independent” here?
 Alternative to the two independent sample t- test What is the meaning of independent here")
38
Contingency Tables Chi-square tests for contingency tables (e.g., 2x2 tables) are often categorized as non- parametric tests. nominal or categorical data which cannot be analyzed using the ranking techniques discussed above. These data cannot be ordered (the data are not ordinal or on an interval/ratio scale) Fisher’s exact test
 Fisher’s exact test.")
39
Contingency Tables

41
Terima kasih

Similar presentations


 Right.>")


 Assumption of population normality 2) homogeneity of variance Parametric more powerful than nonparametric.>")

 Tests Chi-Square.>")
 –Rank sum test (4.2) –Wilcoxon signed-rank test (4.4.2) Thursday: –Welch’s.>")

