Download presentation
Presentation is loading. Please wait.

1
Ordinal Data

2
Ordinal Tests Non-parametric tests Non-parametric tests No assumptions about the shape of the distribution No assumptions about the shape of the distribution Useful When: Useful When: –Scores are ranks –Violated assumptions –There are outliers

3
Frequently Used Ordinal Tests 1. Spearman’s Rank Correlation Coefficient (Chapter 16) 2. Mann-Whitney U-test 3. Wilcoxon Signed Rank Test 4. Kruskal Wallis H-Test 5. Friedman test

4
Spearman’s Rank Correlation Coefficient (r s ) Designed to measure the relationship between variables measured on an ordinal scale of measurement Designed to measure the relationship between variables measured on an ordinal scale of measurement Alternative to Pearson correlation Alternative to Pearson correlation –Treatment of ordinal data –Good even if data is interval or ratio –Spearman can be used for nonlinear relationships
 Designed to measure the relationship between variables measured on an ordinal scale of measurement Designed to measure the relationship between variables measured on an ordinal scale of measurement Alternative to Pearson correlation Alternative to Pearson correlation –Treatment of ordinal data –Good even if data is interval or ratio –Spearman can be used for nonlinear relationships")
5
Spearman’s Rank Correlation Coefficient (rs)
")
6
Alternative Formula where: n = number of items being ranked d = difference between the X rank and Y rank for each individual d = difference between the X rank and Y rank for each individual

7
Example XY 719 24 1134 1528 32104 Original Data X Rank XY Rank Y 72192 2141 113344 154283 3251045

8
Mann-Whitney U-test When to use: When to use: –Two independent samples in your experiment Data have only ordinal properties (e.g. rating scale data) OR there is some other problem with the data Data have only ordinal properties (e.g. rating scale data) OR there is some other problem with the data –Non-normality –Non-homogeneity of variance
 OR there is some other problem with the data Data have only ordinal properties (e.g. rating scale data) OR there is some other problem with the data –Non-normality –Non-homogeneity of variance.")
9
Ranked Data

10
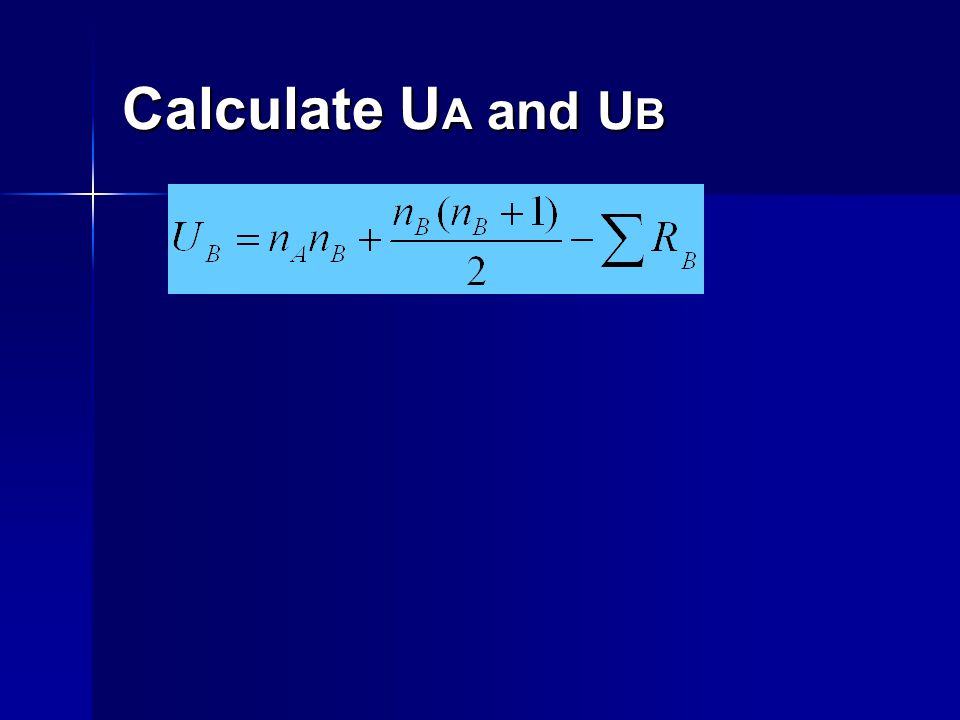
The Test Procedure We compute two “U” values (U A and U B ) based on the sum of the ranks for each sample Where: n A = number in sample A n B = number in sample B R A = sum of ranks group A R B = sum of ranks group B
 based on the sum of the ranks for each sample Where: n A = number in sample A n B = number in sample B R A = sum of ranks group A R B = sum of ranks group B")
11
Worked Out Example Species ASpecies B 724 919 1421 2026 1621 1829 1013 2228 2532 1317 DV: amount of food consumed n A : 10 n B: 10

12
Calculate U A and U B

14
Wilcoxon Signed Ranks Test Each participant observed twice Compute difference scores Analogous to related samples t-test

15
Preliminary Steps of the Test Rank difference scores Compute sum of ranks of “+” and “-” difference scores separately If tied differences, use tied ranks

16
Preliminary Steps of the Test If difference is 0: – –ignore and reduce n – –do not discard Compromise: if there’s only one difference score of 0, then we discard it. Compromise: if there’s only one difference score of 0, then we discard it. –If there’s more than one, we divide them evenly into positive and negative ranks. It doesn’t matter which is which, because they’re all 0. –If you have an odd number of 0 differences, then discard one, and divide the rest evenly into positive and negative ranks.

17
The smaller sum is denoted as T The smaller sum is denoted as T T = smaller of T + and T - T = smaller of T + and T - If Ho true, sum of “+” and “-” ranks approx. equal

18
Example ParticipantBeforeAfter 12.12.2 23.92.8 33.82.5 4 2.6 52.41.9 63.61.8 73.42 82.41.6 Is there enough evidence to conclude that there is a difference in headache hours before and after the new drug? = 0.01

19
Kruskal-Wallis Test Used to test for differences between three or more treatment conditions from an independent measures design Used to test for differences between three or more treatment conditions from an independent measures design Analogous to the one-way independent measures ANOVA EXCEPT data consist of ranks Analogous to the one-way independent measures ANOVA EXCEPT data consist of ranks Does not require the assumption of normally distributed populations Does not require the assumption of normally distributed populations R i, is the sum of ranks for each group N is the total sample size n i is the sample size of the particular group

20
Friedman Test A nonparametric test invented by Milton Friedman (the Nobel prize winning economist) A nonparametric test invented by Milton Friedman (the Nobel prize winning economist) Used to test for differences between three or more treatment conditions from an dependent measures design Used to test for differences between three or more treatment conditions from an dependent measures design Analogous to the one-way repeated measures ANOVA EXCEPT data consist of ranks Analogous to the one-way repeated measures ANOVA EXCEPT data consist of ranks Follows the 2 distribution when we have at least 10 scores in each of the 3 columns or at least 5 scores in each of 4 columns Follows the 2 distribution when we have at least 10 scores in each of the 3 columns or at least 5 scores in each of 4 columns July 31, 1912 – November 16, 2006
 A nonparametric test invented by Milton Friedman (the Nobel prize winning economist) Used to test for differences between three or more treatment conditions from an dependent measures design Used to test for differences between three or more treatment conditions from an dependent measures design Analogous to the one-way repeated measures ANOVA EXCEPT data consist of ranks Analogous to the one-way repeated measures ANOVA EXCEPT data consist of ranks Follows the 2 distribution when we have at least 10 scores in each of the 3 columns or at least 5 scores in each of 4 columns Follows the 2 distribution when we have at least 10 scores in each of the 3 columns or at least 5 scores in each of 4 columns July 31, 1912 – November 16, 2006")
21
Friedman Test There are specific tables for Friedman’s test statistic for up to k=5 variables There are specific tables for Friedman’s test statistic for up to k=5 variables Otherwise use chi-square tables because Fr is distributed approximately as chi-square with df= k-1 Otherwise use chi-square tables because Fr is distributed approximately as chi-square with df= k-1 If 2 F >= the tabled value for df =k-1, then the result is significant, and we can say the difference in total ranks between the k conditions is not due to chance variation If 2 F >= the tabled value for df =k-1, then the result is significant, and we can say the difference in total ranks between the k conditions is not due to chance variation

22
Summary Table: Parametric Tests & Their Non-Parametric Counterparts Parametric TestNon-Parametric Test Independent Samples t-testMann-Whitney U Test Related Samples t-test Wilcoxon Signed Rank Test One Way Between Subjects ANOVA Kruskal-Wallis Test One Way Repeated Subjects ANOVA Friedman Test Pearson CorrelationSpearman Rank-Order Correlation

Similar presentations


2000 South-Western College Publishing.>")
 Type of Categorization One Categorical Variable Chi-Square – Goodness-of-Fit Two Categorical Variables.>")


