Download presentation
Presentation is loading. Please wait.

1
Statistical Tests Karen H. Hagglund, M.S.

2
Research: How Do I Begin???

3
Take It “Bird by Bird” Anne Lamott

4
Let’s Take it Step by Step...
Identify topic Literature review Variables of interest Research hypothesis Design study Power analysis Write proposal Design data tools Committees Collect data Set up spreadsheet Enter data Statistical analysis Graphs Slides / poster Write paper / manuscript

5
Confused by Statistics ?

6
Goals To understand why a particular statistical test was used for your research project To interpret your results To understand, evaluate, and present your results

7
Free Statistics Software
Mystat: List of Free Statistics Software:

8
Before choosing a statistical test…
Figure out the variable type Scales of measurement (qualitative or quantitative) Figure out your goal Compare groups Measure relationship or association of variables
 Figure out your goal. Compare groups. Measure relationship or association of variables.")
9
} } Scales of Measurement Nominal Ordinal Qualitative Interval Ratio
Quantitative

10
Nominal Scale (discrete)
Simplest scale of measurement Variables which have no numerical value Variables which have categories Count number in each category, calculate percentage Examples: Gender Race Marital status Whether or not tumor recurred Alive or dead

11
Ordinal Scale Variables are in categories, but with an underlying order to their values Rank-order categories from highest to lowest Intervals may not be equal Count number in each category, calculate percentage Examples: Cancer stages Apgar scores Pain ratings Likert scale

12
Interval Scale Quantitative data Can add & subtract values
Cannot multiply & divide values No true zero point Example: Temperature on a Celsius scale 00 indicates point when water will freeze, not an absence of warmth

13
Ratio Scale (continuous)
Quantitative data with true zero Can add, subtract, multiply & divide Examples: Age Body weight Blood pressure Length of hospital stay Operating room time

14
} } Scales of Measurement Nominal Ordinal
Interval Ratio Lead to nonparametric statistics } Lead to parametric statistics

15
Two Branches of Statistics
Descriptive Frequencies & percents Measures of the middle Measures of variation Inferential Nonparametric statistics Parametric statistics

16
Descriptive Statistics
First step in analyzing data Goal is to communicate results, without generalizing beyond sample to a larger group

17
Frequencies and Percents
Number of times a specific value of an observation occurs (counts) For each category, calculate percent of sample
 For each category, calculate percent of sample.")
18
Measures of the Middle or Central Tendency
Mean Average score sum of all values, divided by number of values Most common measure, but easily influenced by outliers Median 50th percentile score half above, half below Use when data are asymmetrical or skewed

19
Measures of Variation or Dispersion
Standard deviation (SD) Square root of the sum of squared deviations of the values from the mean divided by the number of values Standard error (SE) Standard deviation divided by the square root of the number of values SD = sum of (individual value – mean value) 2 ________________________________________________ number of values
 Square root of the sum of squared deviations of the values from the mean divided by the number of values. Standard error (SE) Standard deviation divided by the square root of the number of values. SD = sum of (individual value – mean value) 2. ________________________________________________. number of values.")
20
Measures of Variation or Dispersion
Variance Square of the standard deviation Range Difference between the largest & smallest value

23
Inferential Statistics
Sample Population Nonparametric tests Used for analyzing nominal & ordinal variables Makes no assumptions about data Parametric tests Used for analyzing interval & ratio variables Makes assumptions about data Normal distribution Homogeneity of variance Independent observations

24
Which Test Do I Use? Step 1 Know the scale of measurement
Step 2 Know your goal Is it to compare groups? How many groups do I have? Is it to measure a relationship or association between variables?

25
Key Inferential Statistics
} Chi-Square Fisher’s exact test T-test Unpaired Paired Analysis of Variance (ANOVA) Pearson’s Correlation Linear Regression Nonparametric Association/Relationship } Parametric Compare groups } Parametric Compare groups } Parametric Association/Relationship
 Pearson’s Correlation. Linear Regression. Nonparametric. Association/Relationship. } Parametric. Compare groups. } Parametric. Compare groups. } Parametric. Association/Relationship.")
26
Probability and p Values
1 in 20 or 5% chance groups are not different when we say groups are significantly different p < 0.01 1 in 100 or 1% chance of error p < 0.001 1 in 1000 or .1% chance of error

27
Research Hypothesis Topic research question
Research question hypothesis Null hypothesis (H0) Predicts no effect or difference Alternative hypothesis (H1) Predicts an effect or difference
 Predicts no effect or difference. Alternative hypothesis (H1) Predicts an effect or difference.")
28
Example

29
Topic: Cancer & Smoking
Research Question: Is there a relationship between smoking & cancer? H0: Smokers are not more likely to develop cancer compared to non-smokers. H1: Smokers are more likely to develop cancer than are non-smokers.

30
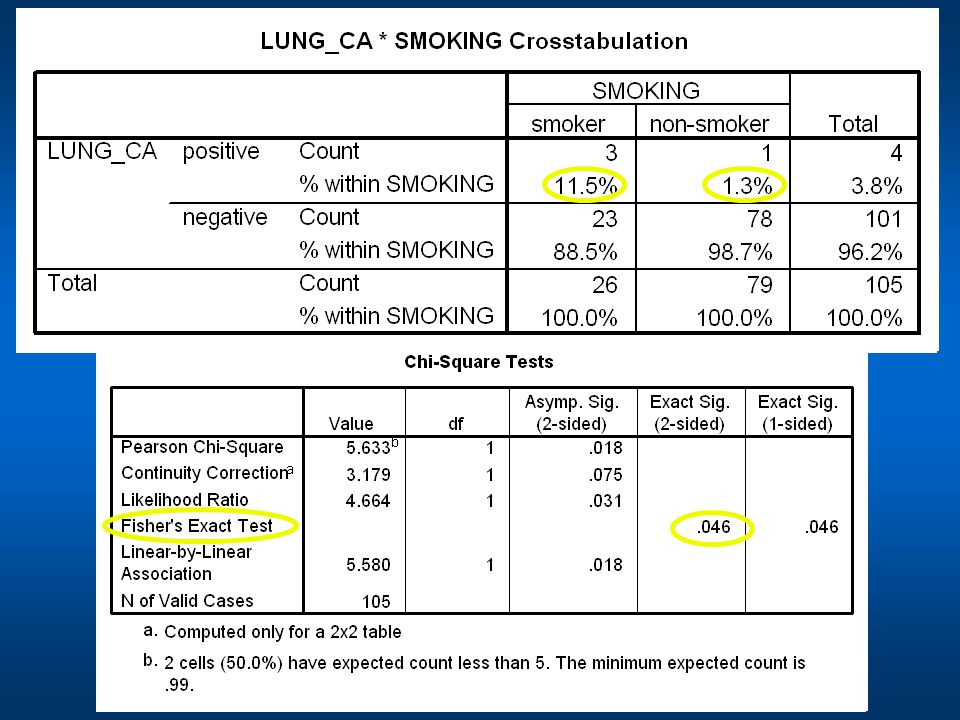
Are These Categorical Variables Associated?

31
2 Chi-Square Most common nonparametric test
Use to test for association between categorical variables Use to test the difference between observed & expected proportions The larger the chi-square value, the more the numbers in the table differ from those we would expect if there were no association Limitation Expected values must be equal to or larger than 5

32
Let’s Test For Association
Low SES 38.9%, Middle SES 20.3%, High SES 26.1%

33
Alternative to Chi-Square
Fisher’s exact test Is based on exact probabilities Use when expected count <5 cases in each cell and Use with 2 x 2 contingency table R A Fisher

35
Do These Groups Differ?

36
Unpaired t-test or Student’s t-test
William Gossett Frequently used statistical test Use when there are two independent groups

37
Unpaired t-test or Student’s t-test
Test for a difference between groups Is the difference in sample means due to their natural variability or to a real difference between the groups in the population? Outcome (dependent variable) is interval or ratio Assumptions of normality, homogeneity of variance & independence of observations
 is interval or ratio. Assumptions of normality, homogeneity of variance & independence of observations.")
38
Let’s Test For A Difference
Smokers’ BMI = ± 5.27 Non-Smokers’ BMI = ± 5.48

39
Do These Groups Differ? Light smoker < 1 pack/day
Heavy smoker > 1 pack/day

40
Analysis of Variance (ANOVA) or F-test
Three or more independent groups Test for a difference between groups Is the difference in sample means due to their natural variability or to a real difference between the groups in the population? Outcome (dependent variable) is interval or ratio Assumptions of normality, homogeneity of variance & independence of observations
 is interval or ratio. Assumptions of normality, homogeneity of variance & independence of observations.")
41
Let’s Test For A Difference
Non-Smokers’ BMI = ± 5.48 Light Smokers’ BMI = ± 4.96 Heavy Smokers’ BMI = ± 5.62

42
Is there a relationship between the variables?

43
Pearson’s Correlation
Karl Pearson Measures the degree of relationship between two variables Assumptions: Variables are normally distributed Relationship is linear Both variables are measured on the interval or ratio scale Variables are measured on the same subjects

44
Scatterplots r = -1.0 ---- +1.0
Perfect positive correlation Perfect negative correlation No correlation

45
Let’s Test For A Relationship

47
Interpretation of Results
The size of the p value does not indicate the importance of the result Appropriate interpretation of statistical test Group differences Association or relationship “Correlation does not imply causation”

48
Don’t Lie With Statistics !

Similar presentations


: Analysing data.>")


