Download presentation
Presentation is loading. Please wait.

1
Professor Alex Hirschfield, HonMFPH Professor of Criminology and Director International Centre for Applied Criminology ICAC University of Huddersfield, Floor 14, CSB, Queensgate, Huddersfield, UK HD1 3DH E-mail: a.hirschfield@hud.ac.uk 8 th International Investigative Psychology Conference, The Keyworth Centre, London, 15 th -16 th December 2005 Locating Spatial Analyses of Crime: The Crime Analysis Framework

2
Why Map & Analyse Crime Data ? to identify the scale and distribution of crime and disorder to explore relationships between crime and the environment (physical & social) to target resources for crime prevention to evaluate the impact of crime prevention to inform police operations to apprehend offenders to profile the spatial behaviour of offenders. to predict the spatial and temporal distribution of offences to develop Early Warning Systems of emerging problems to communicate with and to engage communities to support bids for extra resources from government
 to target resources for crime prevention to evaluate the impact of crime prevention to inform police operations to apprehend offenders to profile the spatial behaviour of offenders. to predict the spatial and temporal distribution of offences to develop Early Warning Systems of emerging problems to communicate with and to engage communities to support bids for extra resources from government.")
3
The Crime Analysis Framework (Hirschfield, A., 2005) Crime Centred Analysis (CCA) Crime Environment Analysis (CEA) Aggregate Disaggregate c c f f A B D E
 Crime Centred Analysis (CCA) Crime Environment Analysis (CEA) Aggregate Disaggregate c c f f A B D E")
4
Crime Centred Analysis I Where do crimes occur ? When do crimes occur ? When crimes occur, where do they occur ? Where crimes occur, when do they occur ? How do crimes occur (MO analysis) Do areas with one crime problem have other crime problems? Where are these areas ? Which and how many crimes do they have ? How much of the population is affected (prevalence) ? How concentrated is crime (socially,temporally, over space) ?
 Do areas with one crime problem have other crime problems. Where are these areas . Which and how many crimes do they have . How much of the population is affected (prevalence) . How concentrated is crime (socially,temporally, over space) .")
5
Crime Centred Analysis II To what extent are there repeat crimes? What is the time interval between repeats? Where are repeat crimes concentrated? Who are the victims? Who are the offenders? Do offenders live in the areas with the highest crime rates? Do offence locations relate to those of previous offences? Is the volume of crime decreasing or increasing? Are crimes affecting the same areas or new areas? Are crimes diffusing or concentrating? Is there evidence of displacement or crime switch?

6
Crime Environment Analysis I Crime Environment Analysis Physical & Built Environment Land use, Terrain, Urban Design, Communications Social Environment Migration, ethnicity, deprivation, social cohesion Policy Environment Target Hardening, CCTV, Alley-gates, Street Wardens, Home watch, other ABIs

7
Crime Environment Analysis II What types of area have high crime? Are they student areas or deprived estates? Do they have particular types of housing /built environment? Are they Policy Priority Areas? What types of transport and communications do they have? Are they accessible to offenders physically/ socially ? Do they have poor natural surveillance? Do they have a large number of potential crime attractors? Do they have crime prevention measures already? Are they deployed in the right places at the right times ? How does the crime prevention relate to crime change ?

8
Crime Centred Analysis(CCA)
")
9
Techniques for Aggregate CCAs Tabulation of crime counts and derivation of crime rates Identification of areas with significantly high and significantly low crime Calculation of the concentration of crime at area level Identification of crime mix and its variation across areas

10
WardHouseholdsBurglaryTheft of Vehicle Theft From Vehicle 1 2,75235.610.937.0 2 1,45921.212.330.1 2 2,36629,515.244.8 4 2,39412.96.230.4 5 2,28452.110.530.6 6 2,14914.419.5101.4 7 2,83924.613.731.7 8 2,50925.119.556.6 9 2,87647.219.870.3 Mean 25.112.040.4 SD 12.25.220.0 Distinguishing High and Low Crime Rates

11
Malicious Ignition Dwelling Fires 1998/99 Resource Targeting Table (RRT) 25% of Incidents 50% of Incidents
 25% of Incidents 50% of Incidents")
12
CCA: Crime Mix

13
WardBurglary Prevalence Burglary Concentration Burglary Prominence 17 52.1 (1)8.8 (2)20.3 (1) 21 47.2 (2)10.0 (1)11.6 (14) 1 42.2 (3)7.3 (4)12.0 (12) 8 35.6 (4)6.5 (7)13.6 (8) 13 35.6 (5)7.2 (5)14.4 (7) 9 34.1 (6)8.5 (3)18.9 (3) 7 33.1 (7)6.6 (6)12.2 (11) 15 26.5 (8)5.2 (9)10.7 (17) 2 25.9 (9)4.2 (11)16.3 (5) 20 25.1 (10)4.6 (10)7.6 (20) 19 24.6 (11)5.2 (9)11.3 (16) 14 21.2 (12)2.3 (16)19.0 (2)
8.8 (2)20.3 (1) (2)10.0 (1)11.6 (14) (3)7.3 (4)12.0 (12) (4)6.5 (7)13.6 (8) (5)7.2 (5)14.4 (7) (6)8.5 (3)18.9 (3) (7)6.6 (6)12.2 (11) (8)5.2 (9)10.7 (17) (9)4.2 (11)16.3 (5) (10)4.6 (10)7.6 (20) (11)5.2 (9)11.3 (16) (12)2.3 (16)19.0 (2)")
14
CCA Mapping Techniques Disaggregate Data Analyses Mapping the distribution of individual incidents (offence, victim, offender locations); Mapping the distribution of repeat incidents (multiple incidents, repeat victims, prolific offenders) Identifying clusters /‘hot spots’ from points Exploring space-time clustering
; Mapping the distribution of repeat incidents (multiple incidents, repeat victims, prolific offenders) Identifying clusters /‘hot spots’ from points Exploring space-time clustering")
15
Criminal Damage to Bus Stops Wirral (Newton 2004) Points
 Points")
16
Criminal Damage to Bus Stops Wirral (Newton 2004) Hot Spots
 Hot Spots")
17
Mapping crime over time (Chainey, 2001)
")
18
Crime Environment Analysis(CEA)
")
19
Techniques for Aggregate CEAs Derivation of crime rates for areas ranked by deprivation level Derivation of crime rates for different types of residential neighbourhood Identification of overlap between high crime and high values on other social indicators (e.g. unemployment) Calculation of the concentration of crime by area type, social indicator
 Calculation of the concentration of crime by area type, social indicator.")
20
Bury Oldham Rochdale Salford Trafford Stockport Tameside Manchester Bolton Wigan h HIGHEST ARSON & HIGHEST DEPRIVATION Highest 10% Arson Highest 10% Deprivation

21
Mapping crime with deprivation

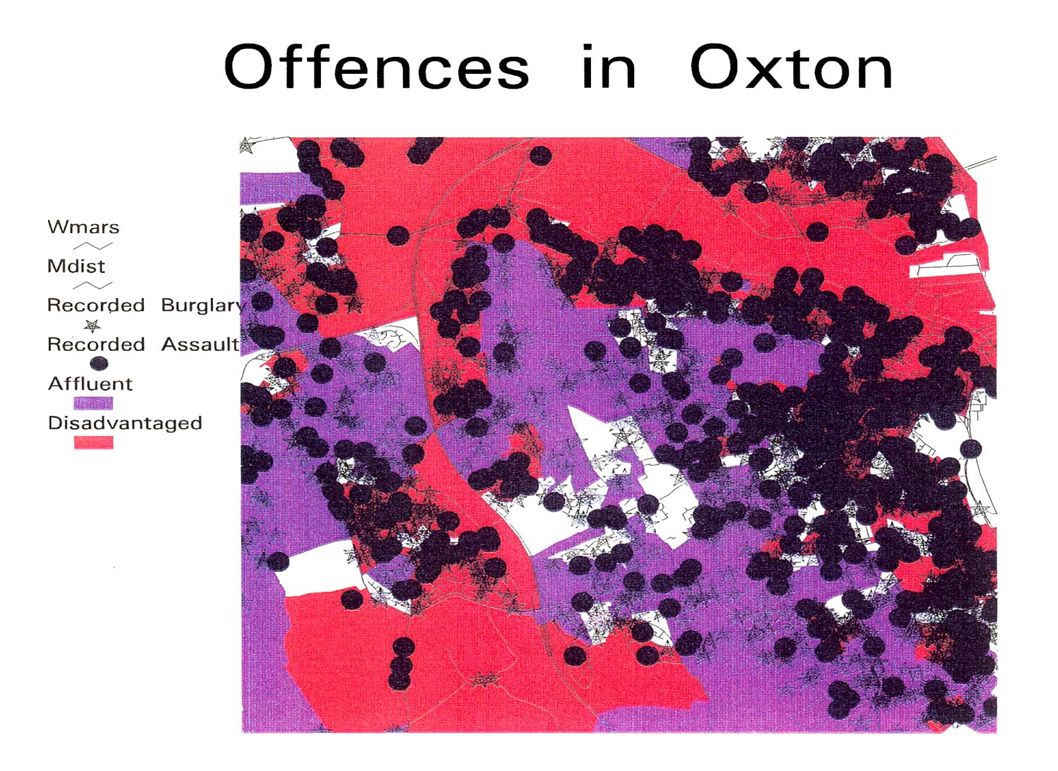
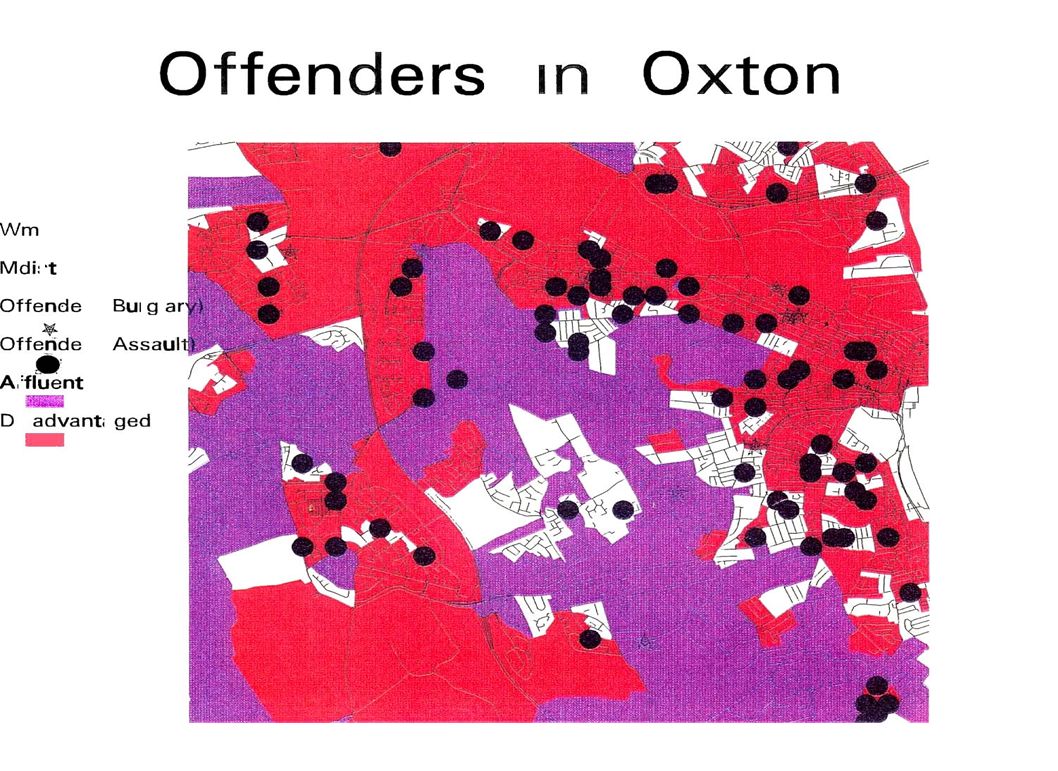
24
CEA Mapping Techniques Disaggregate Data Analyses Mapping incidents on contextual backcloths (Geodemographics, land use maps, digital aerial photos) Mapping hot spots and spatial-temporal clusters in relation to the environment Identifying ‘hot spot’ demographics & land use Conducting specific site and RADIAL analyses
 Mapping hot spots and spatial-temporal clusters in relation to the environment Identifying ‘hot spot’ demographics & land use Conducting specific site and RADIAL analyses")
27
High Definition GIS at Temple University Prof. George Rengert (Temple) Crime Environment Analysis (Disaggregate)
 Crime Environment Analysis (Disaggregate).")
28
Spencer Chainey (Jill Dando Institute, UCL, London) Crime Environment Analysis (Disaggregate)
 Crime Environment Analysis (Disaggregate)")
29
Dr.Andrew Newton, ECRU Bus Stop A Bus Stop B Point C

30
Crime Centred Analysis (CCA) Crime Environment Analysis (CEA) Aggregate Disaggregate c c f f A B D E Crime Centred Analysis (CCA) Crime Environment Analysis (CEA) Aggregate Disaggregate c c f f A B D E Crime Centred Analysis (CCA) Crime Environment Analysis (CEA) Aggregate Disaggregate c c f f A B D E Crime Centred Analysis (CCA) Crime Environment Analysis (CEA) Aggregate Disaggregate c c f f A B D E Crime Centred Analysis (CCA) Crime Environment Analysis (CEA) Aggregate Disaggregate c c f f A B D E t + 1 t + 2 t + 3 t + 4 t + n
 Crime Environment Analysis (CEA) Aggregate Disaggregate c c f f A B D E Crime Centred Analysis (CCA) Crime Environment Analysis (CEA) Aggregate Disaggregate c c f f A B D E Crime Centred Analysis (CCA) Crime Environment Analysis (CEA) Aggregate Disaggregate c c f f A B D E Crime Centred Analysis (CCA) Crime Environment Analysis (CEA) Aggregate Disaggregate c c f f A B D E Crime Centred Analysis (CCA) Crime Environment Analysis (CEA) Aggregate Disaggregate c c f f A B D E t + 1 t + 2 t + 3 t + 4 t + n")
31
Conclusion Much can be gained solely through CCAs CEAs add further insights by identifying factors that facilitate/inhibit crime (e.g. low/ high social cohesion, good/poor natural surveillance) Both CCA and CEA require: Awareness of sources of data on crime, disorder, land use and socio-demographic conditions Expertise in data manipulation and processing Basic skills in data analysis Competence in the use of GIS An ability to interpret the results from analysis
 Both CCA and CEA require: Awareness of sources of data on crime, disorder, land use and socio-demographic conditions Expertise in data manipulation and processing Basic skills in data analysis Competence in the use of GIS An ability to interpret the results from analysis.")
Similar presentations