Download presentation
Presentation is loading. Please wait.

1
Modelling Crime: A Spatial Microsimulation Approach Charatdao Kongmuang School of Geography University of Leeds Supervisors Dr. Graham Clarke, Dr. Andrew Evans, Dr. Dimitris Ballas

2
What is Crime? ‘ Crime is, first of all, a legal conception, human behaviour punishable under the criminal law’ (Mannheim 1965: 22)
.")
3
Why crime? ► It is one of the most important problems facing the UK today. ► Adds stress to people lives and impairs the quality of life of individuals and communities.

4
Study Of Crime Crime Geography Criminology Psychiatry Law PsychologyPolitic Economics Biology Sociology

5
Geography of Crime Crime Mapping Spatial patterns of crime Spatial patterns of crime Ecological Analysis relationship between crime and socio-economic / environmental factors Spatial Analysis- using GIS Hot spot areas Hot spot areas

6
Microsimulation A methodology aimed at building large- scale datasets on the attributes of individual units and analysing policy impacts on these micro units. A methodology aimed at building large- scale datasets on the attributes of individual units and analysing policy impacts on these micro units. (Clarke, 1996) (Clarke, 1996)
 (Clarke, 1996).")
7
Why Spatial Microsimulation? Criminal behaviour is related to current attributes of individuals. Can be used to conduct policy simulations and forecasting. Can generate spatial outcomes at a detailed level of resolution. It has not yet been applied to study crime. crime.

8
Advantages of Spatial Microsimulation Data linkage ability Spatial flexibility Efficiency of storage Ability to update and forecast (Clarke, 1996) (Clarke, 1996)
 (Clarke, 1996)")
9
Drawbacks The difficulty to validating the model outputs outputs Large requirements of computational power power (Clarke, 1996)
")
10
Objectives Build a spatial microsimulation model for crime for crime Use this model for forecasting crime - The effect on crime rates - The effect on crime rates - What types of area tend to have high - What types of area tend to have high crime rates? crime rates? - Estimate individuals’ propensity to - Estimate individuals’ propensity to commit crime and to be a victim. commit crime and to be a victim.

11
Methodology 1. Construct a population microdata set. - A list of individuals along with associated attributes on the basis of Census and Survey data (e.g. British Crime Survey) - Conditional probabilities, calculated from available known data, will be used to reconstruct detailed micro-level populations. 2. Create the sample of individuals based on set of probabilities 3. Simulate Simulation of crime on the basis of individual propensities to commit crime Simulation of crime on the basis of individual propensities to commit crime 4. Validate Compare simulation outputs with actual data (e.g. from West Yorkshire Police) (e.g. from West Yorkshire Police)
 - Conditional probabilities, calculated from available known data, will be used to reconstruct detailed micro-level populations. 2. Create the sample of individuals based on set of probabilities 3. Simulate Simulation of crime on the basis of individual propensities to commit crime Simulation of crime on the basis of individual propensities to commit crime 4. Validate Compare simulation outputs with actual data (e.g. from West Yorkshire Police) (e.g. from West Yorkshire Police).")
12
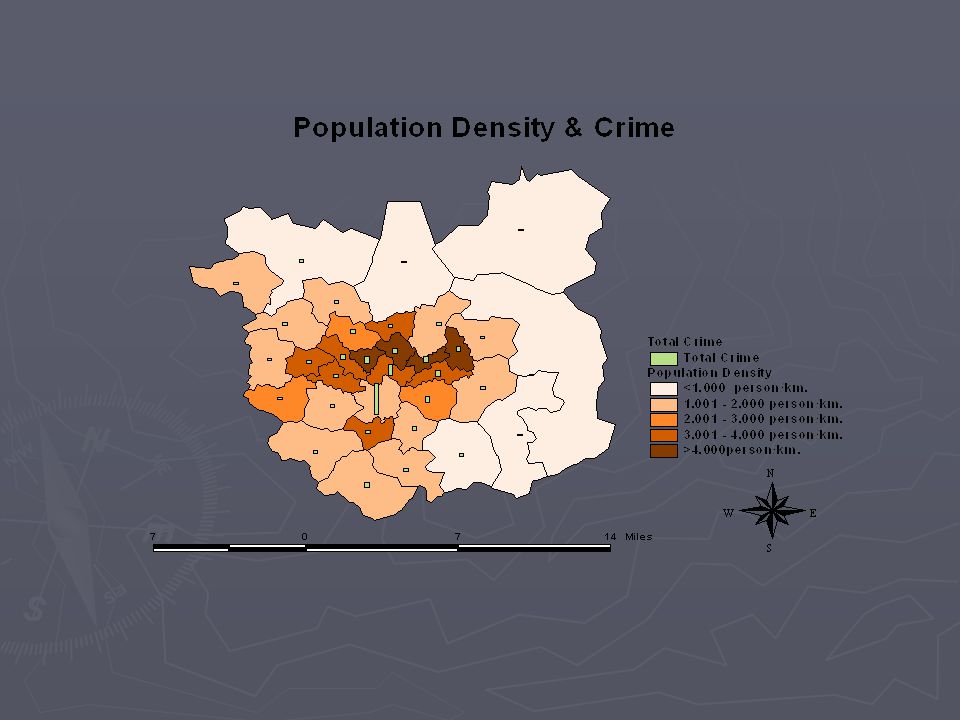
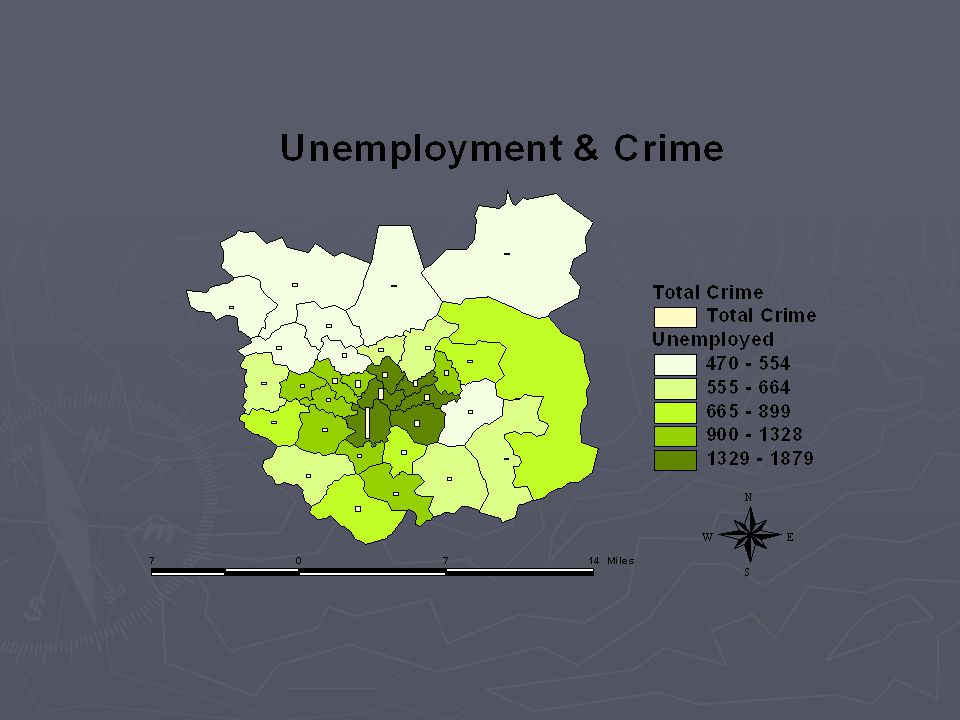
Category Indicator Indicator High Propensity Demographic Characteristics of Offender AgeSex Marital Status Ethnic Status Family Status Family Size Young adult MaleSingle Minority Group Broken Home, divorce (weak family life) Large Socio-Economic Status of Offender IncomeOccupationEmploymentEducation Social Class Type of tenure Low income UnskilledUnemploymentLessLowRented Physical Features of the household Housing Density of living EnvironmentSubstandard High density Poor Local/Regional characteristics Local/Regional characteristicsUrbanisation Population density HighHigh Characteristics of victim AgeSexLifestyleTenure Young adult Male Away home Council estate Proximity to opportunity Neighbourhood Inner city Border zone located close to disadvantage areas Low Socio-Economic Status
 Large Socio-Economic Status of Offender IncomeOccupationEmploymentEducation Social Class Type of tenure Low income UnskilledUnemploymentLessLowRented Physical Features of the household Housing Density of living EnvironmentSubstandard High density Poor Local/Regional characteristics Local/Regional characteristicsUrbanisation Population density HighHigh Characteristics of victim AgeSexLifestyleTenure Young adult Male Away home Council estate Proximity to opportunity Neighbourhood Inner city Border zone located close to disadvantage areas Low Socio-Economic Status")
13
Crime Data The official statistics do not represent the total crime. Only 27% of the total offences are recorded Only 27% of the total offences are recorded by the police (Home Office, 1995). by the police (Home Office, 1995). Reported crime Unreported crime
. by the police (Home Office, 1995). Reported crime Unreported crime.")
14
Sources of Data DataSourceDetail Crime in Leeds West Yorkshire Police Types of crime Date and time occur Police division, Beat House number, Street number Postcode OS references Easting & Northing Victim characteristics (Gender,Age, Ethnicity) Ethnicity) Offender Characteristics Pre-Sentence Reports (PSRs) Employment Status AgeEthnicity Victimisation British Crime Survey Age, Gender, Marital Status Income, Tenure, Employment Accommodation Type, Lifestyle Conviction/ Criminal Statistics Home Office Gender, Age, Court Proceeding, Sentencing
 Ethnicity) Offender Characteristics Pre-Sentence Reports (PSRs) Employment Status AgeEthnicity Victimisation British Crime Survey Age, Gender, Marital Status Income, Tenure, Employment Accommodation Type, Lifestyle Conviction/ Criminal Statistics Home Office Gender, Age, Court Proceeding, Sentencing")
15
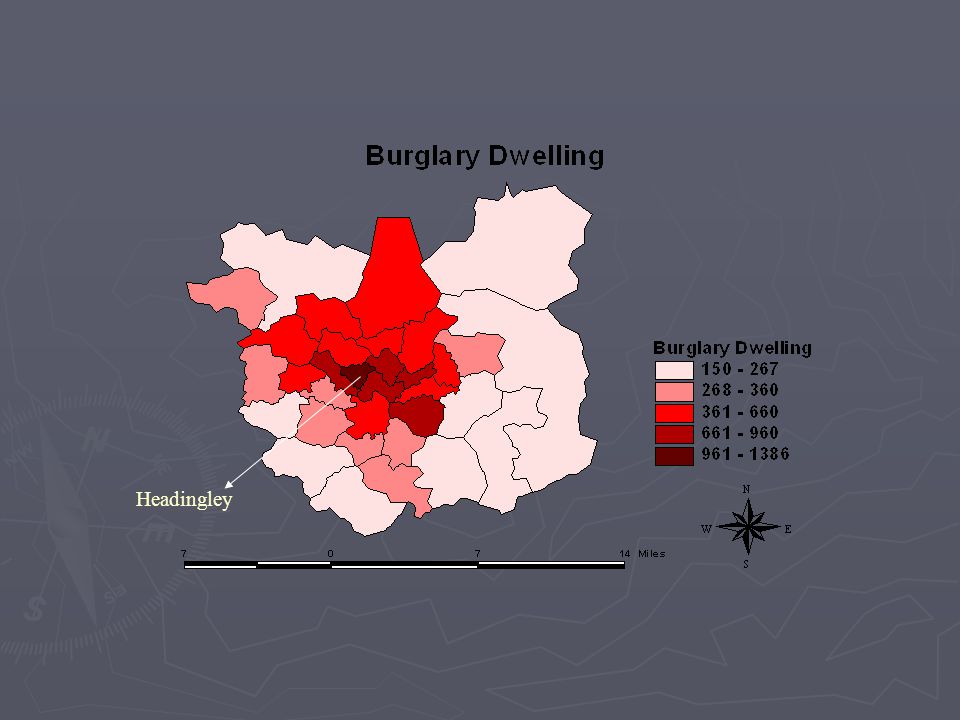
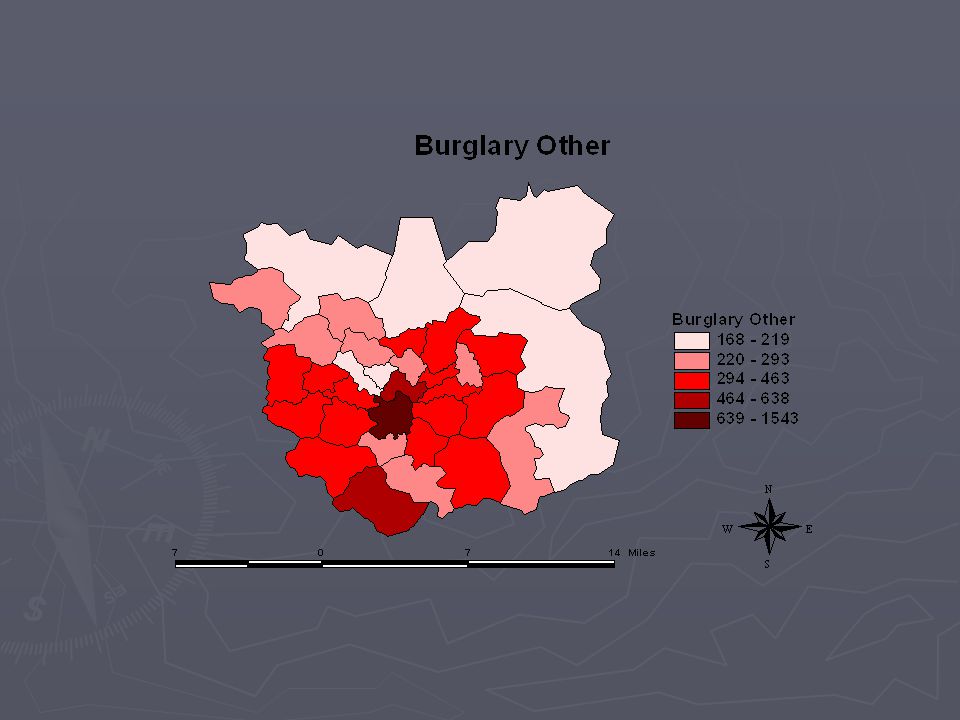
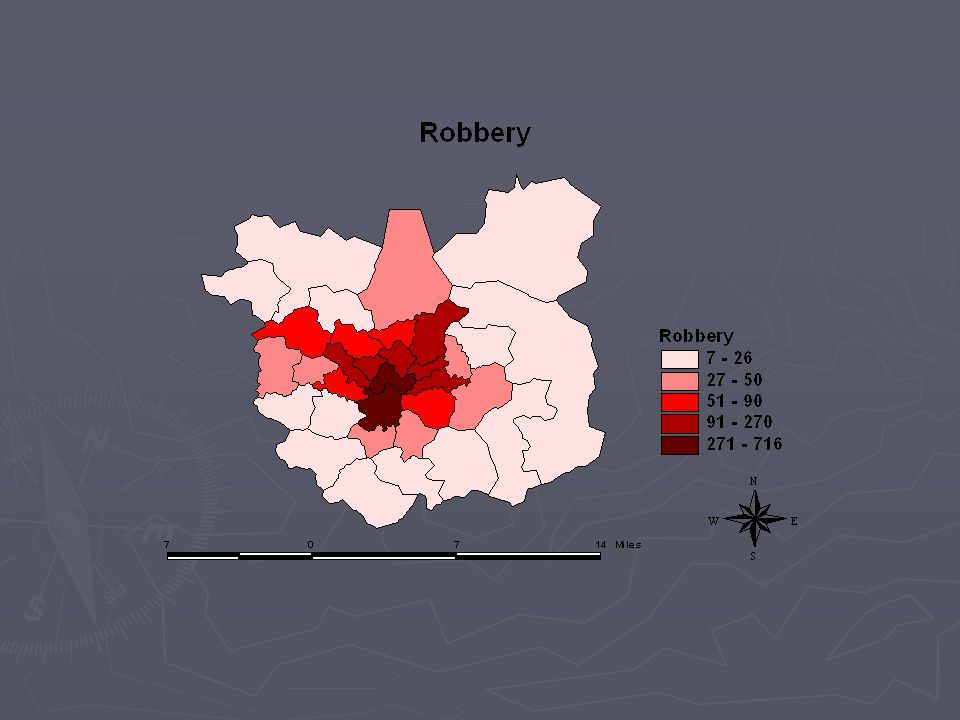
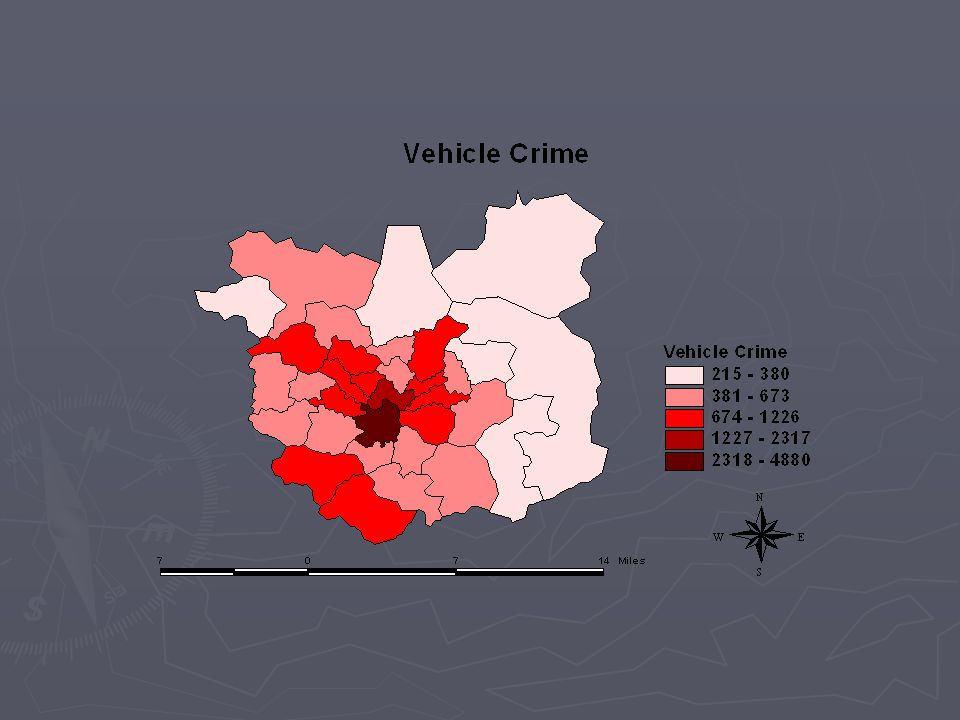
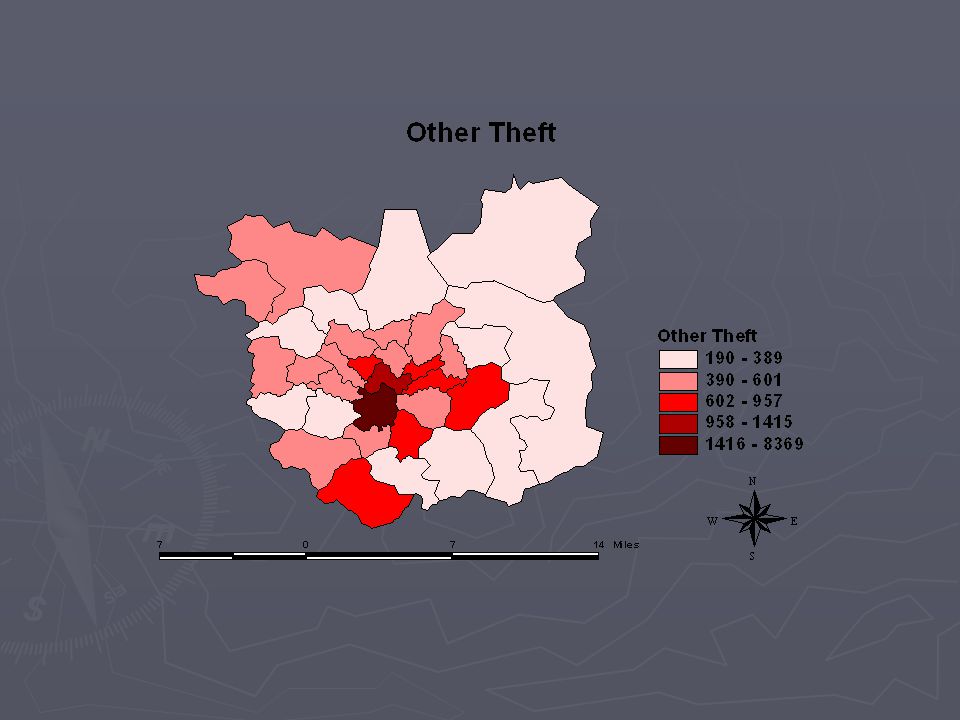
Types of Crime Robbery Burglary - Burglary Dwelling - Burglary Other Vehicle Crime Theft Criminal Damage

16
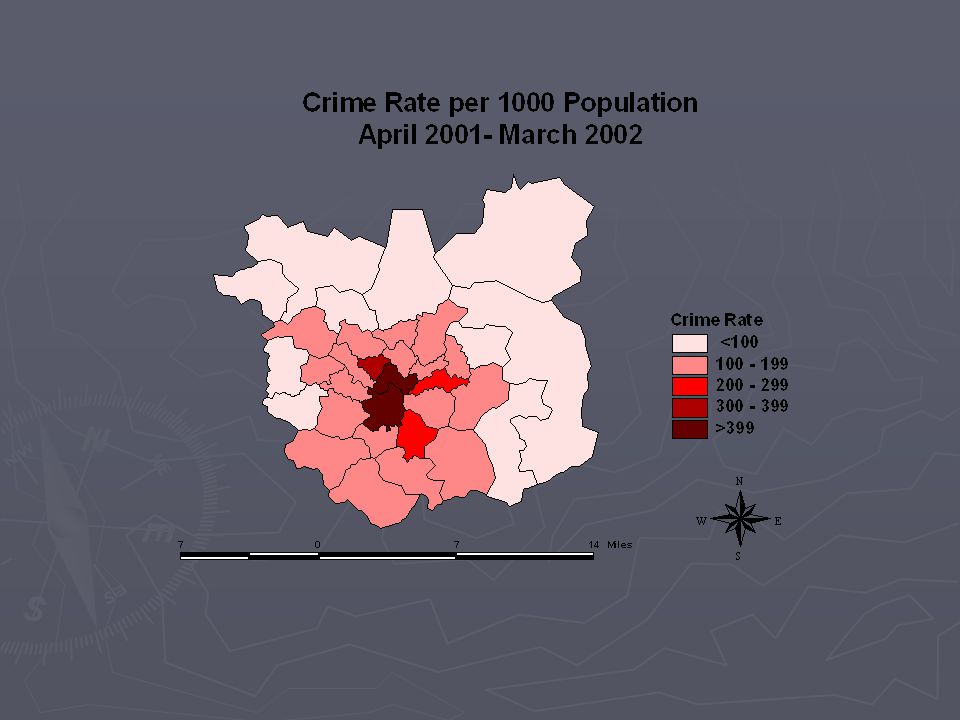
Crime in Leeds In West Yorkshire, 40.9% of all crime committed takes place in Leeds Crime Rate 2000/2001 Crimes/1000 pop. Crimes/1000 pop. Leeds: 146 West Yorkshire: 124 West Yorkshire: 124 England: 102 England: 102 (Leeds Community Safety, 2001) (Leeds Community Safety, 2001) Burglary and vehicle crime are the highest crimes in Leeds.
 (Leeds Community Safety, 2001) Burglary and vehicle crime are the highest crimes in Leeds..")
17
Offenders in Leeds Predominantly male, white 56% are unemployed Offender characteristics are related to drug, alcohol, financial problems, and drug, alcohol, financial problems, and unemployment unemployment (Leeds Community Safety, 2001) (Leeds Community Safety, 2001)
 (Leeds Community Safety, 2001)")
18
Victims in Leeds The most common age 30-39 (1999-2000) 30-39 (1999-2000) over 40 (2000-2001) over 40 (2000-2001) The number of older people experiencing crime has been increased. crime has been increased. Victims over 40 are most likely to be victims of burglary, criminal damage, theft, and of burglary, criminal damage, theft, and vehicle crime. vehicle crime. (Leeds Community Safety, 2001) (Leeds Community Safety, 2001)
 (Leeds Community Safety, 2001).")
19
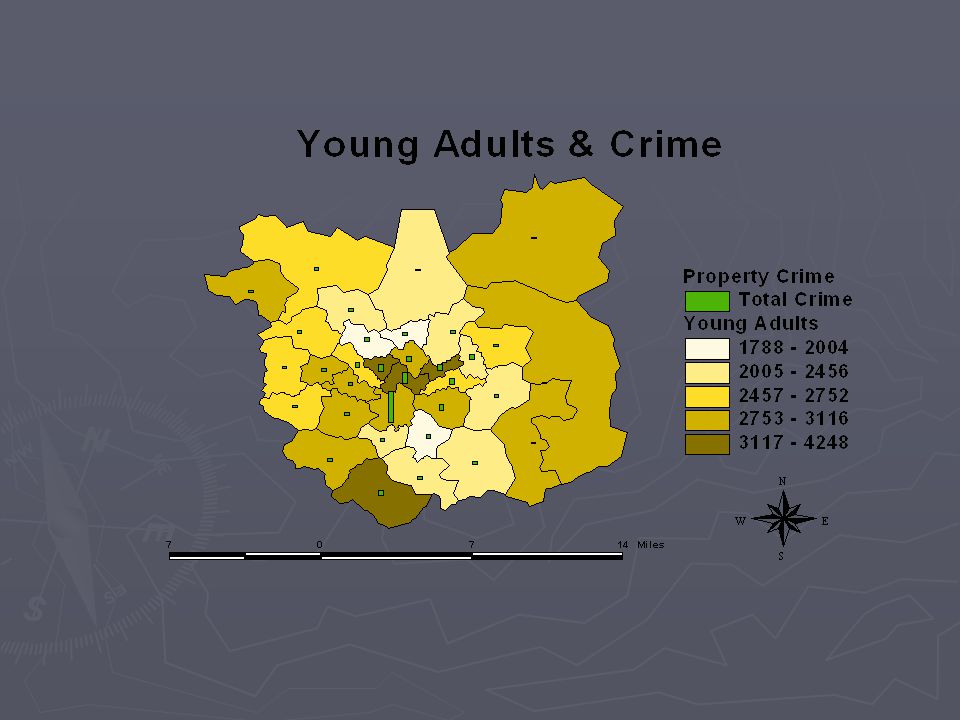
University City and HolbeckBurmantofts Headingley

32
Sawasdee (sa-wat-dee)
")
33
Leeds ward

Similar presentations


 living in private households in England and Wales Measures crime victimisation.>")


