Download presentation
Presentation is loading. Please wait.

1
DASHBOARDS 2015 National Diaper Bank Network Conference Workshop Presented by Pam and Liz Sutherlin HappyBottoms Diaper Bank Kansas City, Missouri

2
PRESENTATION AGENDA What is a dashboard? Why do dashboards matter? What can you track via a dashboard? Examples of dashboards Steps to building a dashboard Resources and handouts

3
WHAT IS A DASHBOARD? Dashboards are reports that illustrate key pieces of data often in a graphical format. They are effective tools for board members, staff and even donors to familiarize themselves with your organizations finances and other key performance measures. Through the use of dashboard, you can leverage financial reports to advance strategic internal discussions. What you report and manage can lead to better performance and better implementation of your mission.

4
WHAT IS A DASHBOARD? Visual Data Quick Agency Status Agency Progress

5
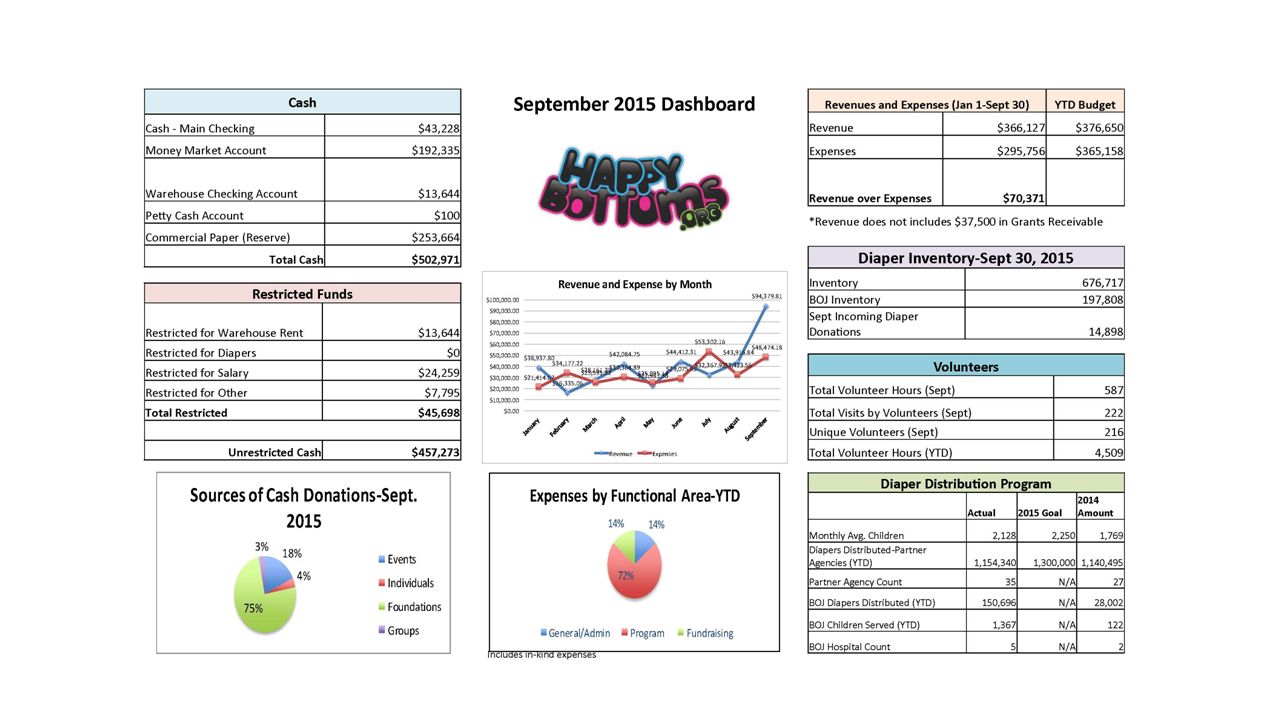
DASHBOARDS

6
Why do dashboards matter? Over the past ten years, dashboards have emerged in nonprofit as a “best practice” for financial management. While many nonprofit regularly produce monthly or quarterly financial reports, board members may find it difficult to sort through the information or in some cases, even understand what all of it means. Dashboards can help board and staff understand large amounts of data. Dashboards can also be shared with donors and grantmakers to help familiarize them with your program and financials.

7
Management Tool Performance Snapshot Helpful for Boards Informative for Staff External uses including donors

8
What can you track via a dashboard? Fund Development Human Resources/Internal Processes Boards/Governance Programs Finances Marketing/Communications Volunteer Management Technology Facility Social Media Influence

9
Examples of Indicators that can be tracked Reserve operating funds Revenue Diversification Donor growth or average gift growth Program outcomes/clients served Client Satisfaction Volunteer supply or growth Strategic Plan goals or big project milestones (see handout for additional metrics that can be tracked)
")
10
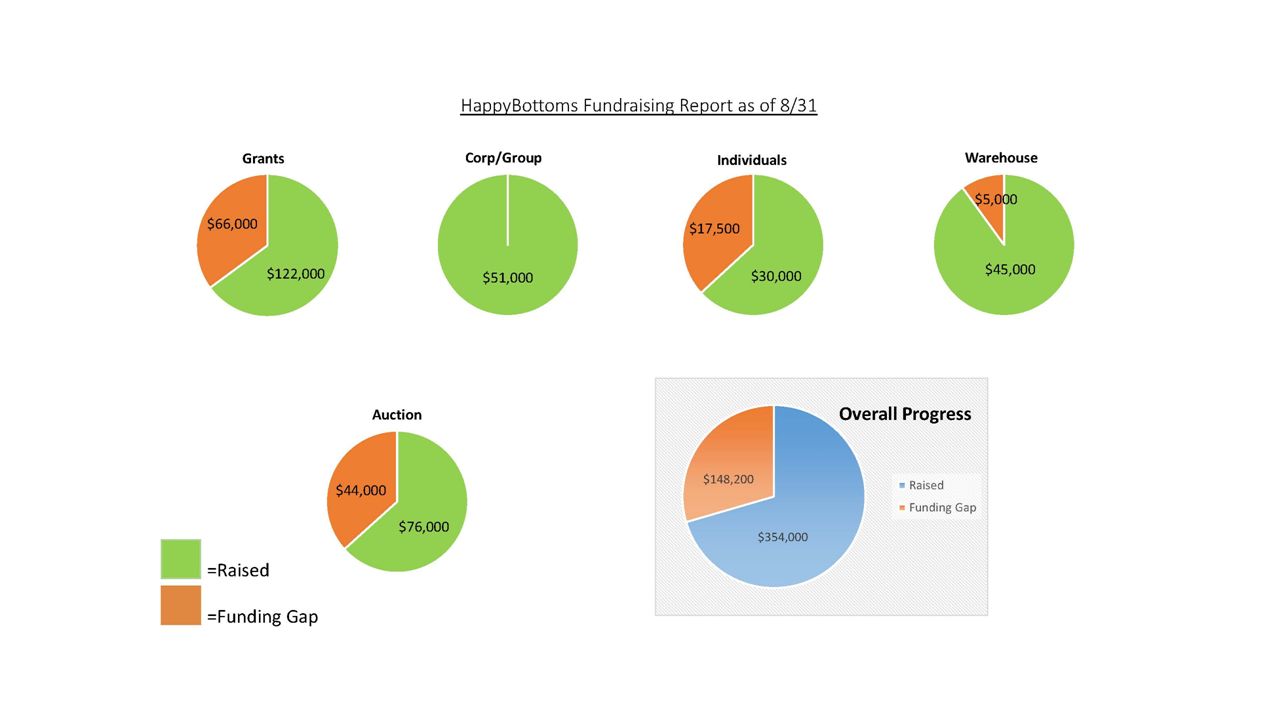
DASHBOARDS

14
STEPS TO BUILDING A DASHBOARD Talk with similar organizations who have started using a dashboard and get examples Create a diverse working group to identify what matters to your organization Use worksheet to select indicators that you believe are important to your organization Determine how you want to present information on your dashboard (pie chart, bar graph, etc) Get feedback from others as you draft the dashboard Pilot the dashboard for a set time, then reevaluate Build a dashboard that you can maintain. Start simple and build from there..

15
Steps to Building a Dashboard The art to creating a good dashboard is identifying what information really matters. Choose key program outcomes Keep it simple; you are driving a car not the space shuttle Capture the short term and the long term picture Revisit and revise the dashboard

16
Resources TEMPLATES: http://chandoo.org/wp/excel-dashboards/#dashboard-templates RESOURCES: https://www.compasspoint.org/board-cafe/dashboard-nonprofits http://www.blueavocado.org/content/nonprofit-dashboard-and-signal-light-boards https://www.councilofnonprofits.org/tools-resources/dashboards-nonprofits https://philanthrophile.wordpress.com/2013/05/29/how-should-a-nonprofit-board- track-progress/

Similar presentations