Download presentation
Presentation is loading. Please wait.

1
POPULATION GROWTH Why do populations rise or fall in particular places?

2
Are we in an overpopulation crisis?

4
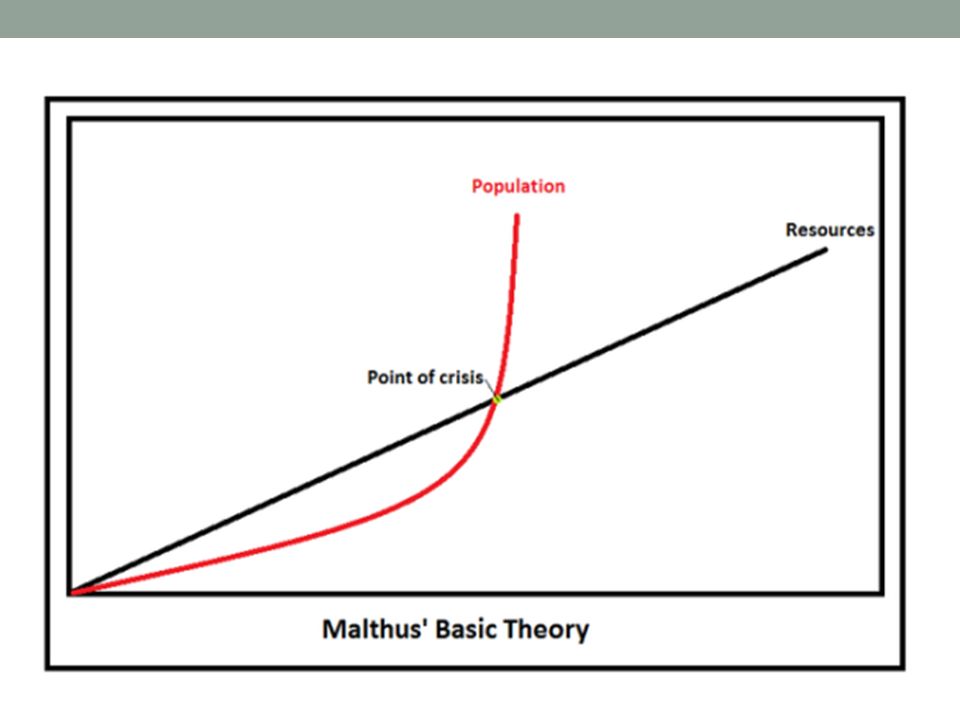
Malthusiansism and Neo-Malthusians Thomas Malthus, An Essay on the Principles of Population (1798) Food supplies grow linearly (incrementally) Population grows exponentially (compounding) We will run out of food! WRONG! Why? Globalization Technology Food production has grown exponentially Neo-Malthusians Overpopulation is the cause of human suffering Look at other resources, not just food

5
Carrying Capacity: An area’s ability to support it’s population – if this is exceeded we refer to it as overpopulation. Overpopulation exists even in sparsely populated regions. Overpopulation refers to the stress population puts on resources, not the number of people in a region!

6
Natural increase Crude birth rate (CBR) minus crude death rate (CDR) From the movie: Where in the world are the highest rates of natural increase? Developing countries Misses two key elements of population Immigration Outmigration

7
NATURAL INCREASE RATE The world average is currently about 1.2 percent. The countries with the highest NIRs are concentrated in Africa and Southwest Asia.

8
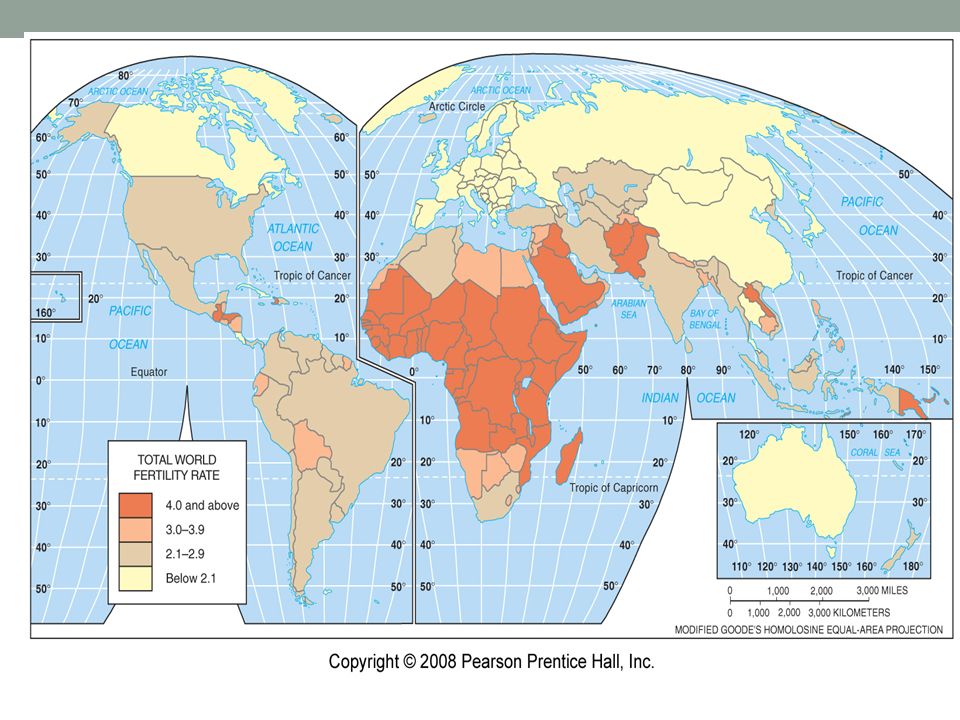
Total Fertility Rate (TFR) Measures the number of births in a country TFR is average number of children a woman will have during her ‘childbearing years’ (approx. ages 15-49) TFR >6 in some African nations What is replacement rate? 2.1 TFR = Keeps population stable (without immigration) When will the world’s TFR fall to 2.2.? 2050 What are the implications? Stable population When will we (probably) reach zero population growth? When birth rate = death rate 2100
 TFR >6 in some African nations What is replacement rate. 2.1 TFR = Keeps population stable (without immigration) When will the world’s TFR fall to What are the implications. Stable population When will we (probably) reach zero population growth. When birth rate = death rate")
10
Aging Populations What factors reduce the TFR? Birth control Too expensive to have several children Educated women Urbanization A lower TFR leads to a higher average population age Explain that What other factors lead to a higher average population age? Better health care Food security Nutrition and exercise Technology Sanitation Less war/conflict Better work safety Out-migration of youth for job opportunities

11
Dependency Ratios Which age group is a country dependent upon? Who is dependent on them? A country with an aging population and low TFR will have a problematic old-age dependency ratio Too many dependent old people (over 65) compared to working-age people (15-64) Where? Europe 2010 24:100 Europe 2050 47:100 Africa 2010 6:100 What are the effects? Many African countries have a challenging child-dependency ratio Africa 2010 74:100 Europe 2010 23:100
 compared to working-age people (15-64) Where. Europe :100 Europe :100 Africa :100 What are the effects. Many African countries have a challenging child-dependency ratio Africa :100 Europe :100.")
12
The Demographic Transition Model Four stages 1.high birth and death rates 2.declines first in death rates 3.then declines in birth rates 4.finally to a stage of low birth and death rates Fifth stage? negative population growth Every country is in one of these stages Irreversible process – once a country moves from one stage to another, it can’t go back.

13
Stage 1: Low Growth Most of Earth’s history spent in this stage However, no country remains there today Hunting/gathering nomadic peoples NIR about zero approx. ½ million people High birth & death rates 8000 B.C. - Agrarian (aka- Agricultural, Neolithic) Revolution caused increase in population However, climate/war/disease caused CDR to rise
 Revolution caused increase in population However, climate/war/disease caused CDR to rise.")
14
Stage 2: High Growth 1750 A.D. - population grew 10X faster than in previous years due to… Industrial Revolution CDR decreases, why? improvements in health, sanitation, and food supplies - people living longer CBR remains the same as Stage 1 NIR is high, population increases Lower child mortality rate, age structure becomes more youthful Stage did not diffuse to Africa, Asia, or Latin America until around 1950 (150 years after Europe & North America)
.")
15
Stage 3: Moderate Growth CBR drops severely - people have fewer children for various reasons CDR continues to fall, but at a slower rate than Stage 2 Population grows because CBR still greater than CDR NIR is smaller than in Stage 2 due to smaller gap between CBR and CDR Malaysia

16
Stage 3: Moderate Growth (continued)… Europe & North America made this transition in the first half of the 20th Century Asian, Latin America moved in recent years Most of Africa is still in Stage 2
… Europe & North America made this transition in the first half of the 20th Century Asian, Latin America moved in recent years Most of Africa is still in Stage 2")
17
Stage 4: Low Growth CBR declines to where it equals CDR NIR approaches zero Zero Population Growth (ZPG) Women in this stage enter labor force rather than remaining home Birth control more available
 Women in this stage enter labor force rather than remaining home Birth control more available")
18
Stage 5 TFR significantly below replacement level Elderly population > youthful population No countries in it YET…

19
Limitations of the DTM Exceptions to the rule FOR ANY MODEL DTM doesn’t tell us: Impact of other demographic variables Migration How long a country will be in each stage

20
Demographic Momentum Even after TFR decreases, population still continues to grow rapidly for several years Why would this happen? (remember Hans and his boxes!) Why would this happen?
 Why would this happen .")
21
Population Pyramids A way to visualize the population composition of a country (or other place) Organized by gender and age range Males are on left, females on right. Youngest people on base of pyramid and older people at the top The shape of a country’s population pyramid tell a lot about the country E.g., a country’s stage in demographic transition gives it a distinctive population structure

22
Each 5 year group with the youngest 0-4 years old at the base of the pyramid are called cohorts. A wide-based pyramid indicates a country in Stage 2 of the Demographic transition.

23
For wealthier countries, the chart is shaped like a lopsided vase. Population is aging, TFRs are declining.

24
For poorer countries, the chart is shaped like a pyramid. Infant mortality rates are high, life expectancy is shorter.

25
Four Patterns of Population Structure Each nation faces different problems

26
POPULATION PYRAMIDS FOR THE UNITED STATES AND SELECTED U.S. COMMUNITIES Laredo has a broad pyramid, indicating higher percentages of young people and fertility rates. Lawrence has a high percentage of people in their twenties because it is the home of the University of Kansas. Naples has a high percentage of elderly people, especially women, so its pyramid is upside down.

27
Population of Germany, 1989 Germany’s population profile is that of a wealthy core country that has passed through the post war baby boom and has a low birthrate. Note the impact of the losses of World War I and World War II.

28
JAPAN’S CHANGING POPULATION PYRAMIDS Japan’s population pyramid has shifted from a broad base in 1950 to a rectangular shape. In the future, the bottom of the pyramid is expected to contract and the top to expand.

29
Slow Growth: A country in stage 4 of the Demographic Transition Model Large number of “older people” Smaller % of young people

30
No Growth: End of stage 4, entering Stage 5 Large number of “older people” Very small % of young people

31
Affect of AIDS on population pyramid for South Africa. Predicted population for 2035, without and with AIDS. With AIDS, looks like a population “chimney.”

32
1995 Population Pyramids reflect the economic prosperity of Western Europe and the less developed countries of Sub- Saharan Africa. In the mid-1990s almost 50% of Africa’s population was under 15 years of age. By contrast the number of people 65 and older in Western Europe is 5 times that of sub-Saharan Africa.

33
FRQ 2010 #3

Similar presentations


>")


