Download presentation
Presentation is loading. Please wait.

1
Inferential Statistics

2
Coin Flip

3
How many heads in a row would it take to convince you the coin is unfair? 1? 10?

4
Number of TossesApprox Probability of All Heads 1(½) 1 =.5 2(½) 2 =.25 3(½) 3 =.125 4(½) 4 =.063 5(½) 5 =.031 6(½) 6 =.016 7(½) 7 =.008 8(½) 8 =.004 9(½) 9 =.002 10(½) 10 =.001 100(½) 100 =7.88-e31
 1 =.5 2(½) 2 =.25 3(½) 3 =.125 4(½) 4 =.063 5(½) 5 =.031 6(½) 6 =.016 7(½) 7 =.008 8(½) 8 =.004 9(½) 9 = (½) 10 = (½) 100 =7.88-e31")
7
Not Seen Ad Seen Ad Number of Cigarettes smoked per day

8
Inferential Statistics To draw inference from a sample about the properties of a population Population distribution: The distribution of a given variable(parameter) for the entire population Sample distribution: A sample of size n, is drawn from the population and the variable’s distribution is called the sample distribution. Sampling distribution: This refers to the properties of a particular test statistic. The sampling distribution draws the distribution of the test statistic if it were calculated from a sample of size n, then resample using n observation to calculate another test statistic. Collect these into the sampling distribution.

9
http://onlinestatbook.com/stat_sim/sampling _dist/index.html http://onlinestatbook.com/stat_sim/sampling _dist/index.html

10
Law of Large Numbers and Central Limit Theorem How can we use this information? We can use our knowledge of the sampling distribution of a test statistic, a single realization of that test statistic to infer the probability that it came from a certain population

11
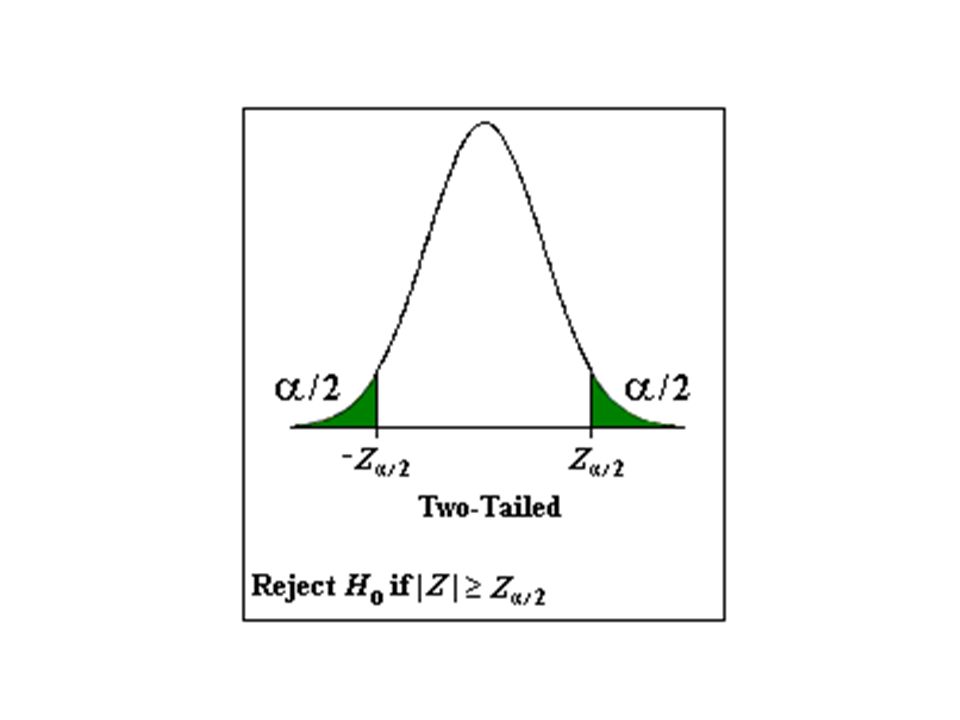
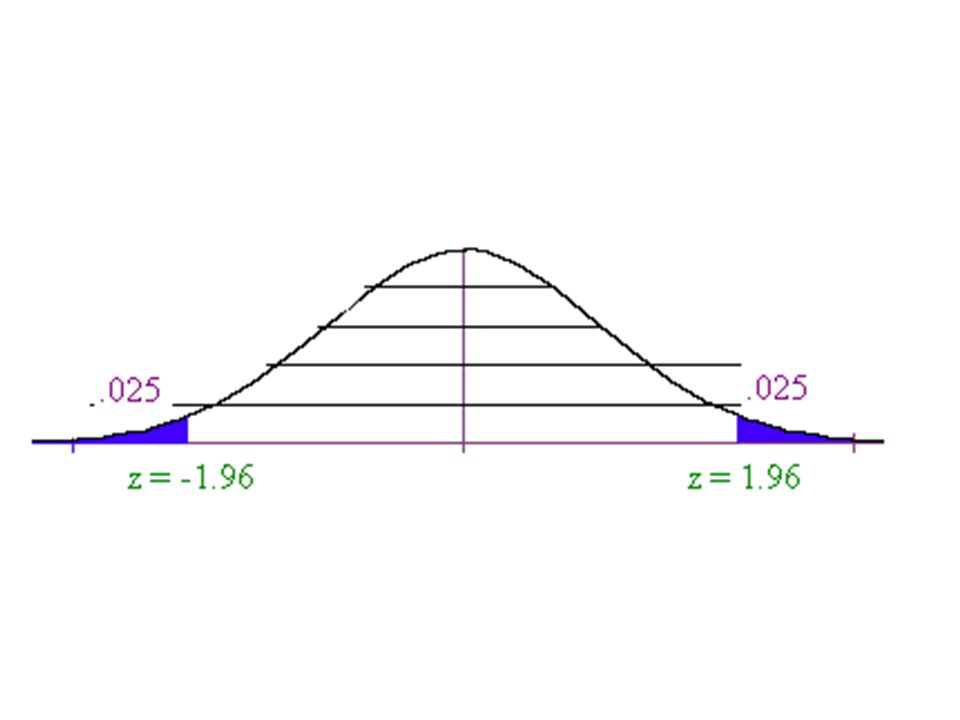
One Sample T-test of mean If the calculate Z statistic is large than the critical value (C.L.) then we reject the null hypothesis, we can also use p-values. That is the exactly probability of drawing a this sample from a population as is hypothesized under the null distribution. If the p-value is large (generally larger than.05 (5%)), we fail to reject the null, if it is small we reject the null. Z distribution (standard normal) vs. t-distribution (students t) The t distribution is used in situations where the population variance is unknown and the sample size is less than 30.
), we fail to reject the null, if it is small we reject the null. Z distribution (standard normal) vs. t-distribution (students t) The t distribution is used in situations where the population variance is unknown and the sample size is less than 30..")
12
Hypothesis testing Develop a hypothesis about the population, then ask does the data in our sample support the hypothesized population characteristic. Ho: Null hypothesis Ha: Alternative hypothesis Significance level. The a critical point where the probability of realizing this sample when pulled from a population as hypothesized under the under the

13
Type I and II Errors (Innocent until proven Guilty) What if Ho = innocent alpha = the nominal size of the test (probability of a type I error) Beta = probability of a type II error 1-beta= the power of a test (ability to reject a false null)
 What if Ho = innocent alpha = the nominal size of the test (probability of a type I error) Beta = probability of a type II error 1-beta= the power of a test (ability to reject a false null)")
14
Confidence Intervals Confidence intervals for the mean/proportion The population mean lies within the range.

15
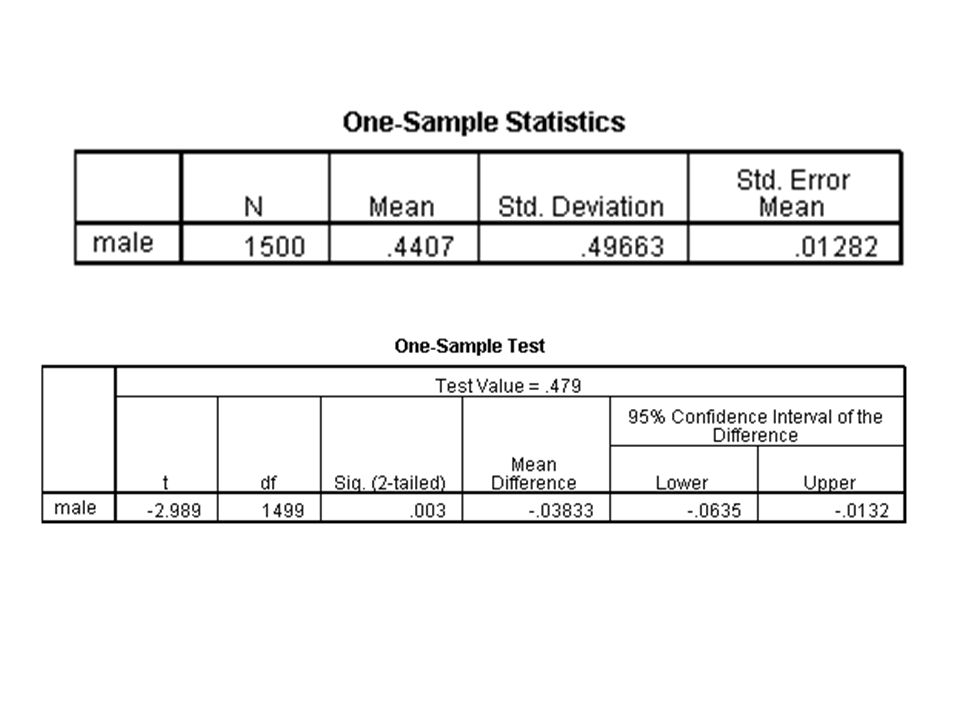
Z(T-Test) of proportion where
 of proportion where")
16
Example: – Males represent 47.9% of the population over the age of 18.

20
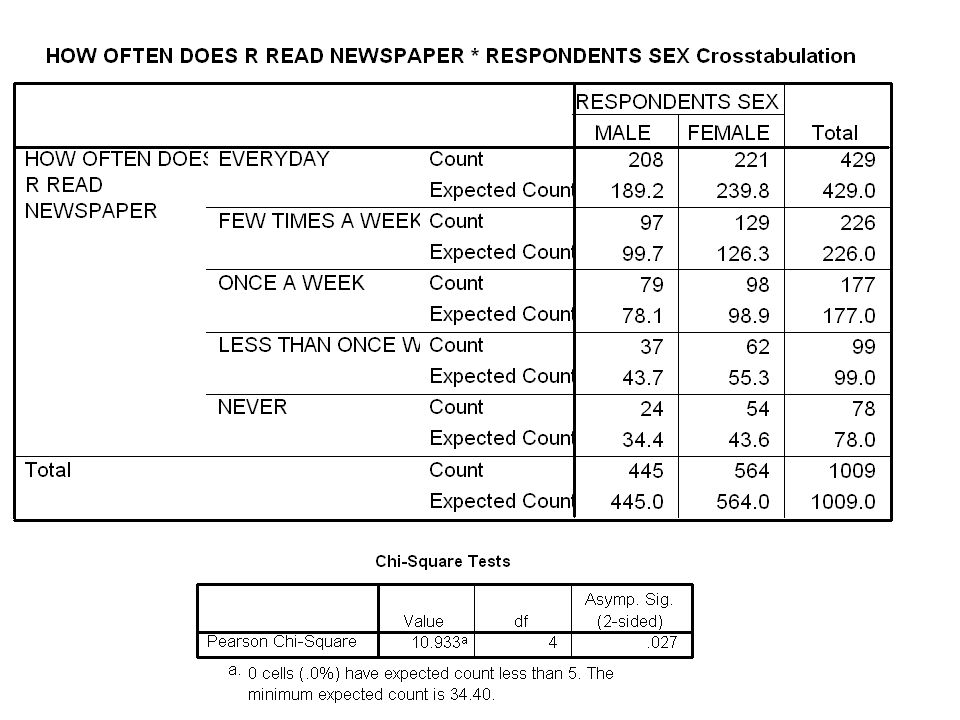
Categorical/Categorical Crosstabulations (2 way frequency tables, Crosstabs, Bivariate distributions)
")
21
Chi-squared test of independence categorical/categorical with degrees of freedom (R-1)(C-1) where R = number of rows and C= number of columns
(C-1) where R = number of rows and C= number of columns")
22
χ 2 =1.01 and the critical value with 1 degree of freedom at the 5% level is 3.84 fail to reject H0: The variables are independent, that is to say knowledge of one will not help to predict the outcome of the other

24
Categorical/Continuous Any statistic that applied to cont. variables done for each category – Mean, median, mode. – Variance, Std dev, skewness, kurtosis

25
Comparison of Means Z test (T-test) comparison of means. Null hypothesis is that the mean difference is 0

26
Where is the pooled estimate of the standard error of the mean, assuming the underlying population variances are equal. Pooled estimate of the standard error (population variances equal)
.")
28
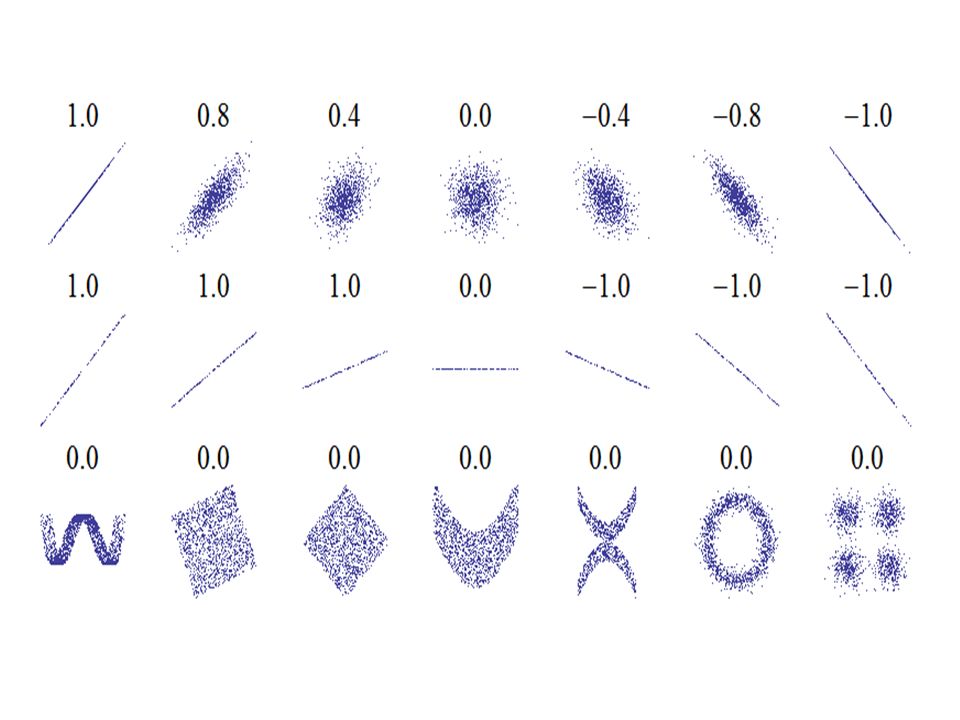
Continuous/Continuous Simple Correlation coefficient (Pearson’s product-moment correlation coefficient, Covariance) this ranges from +1 to -1
 this ranges from +1 to -1")
29
T-Test of correlation coefficient

31
Four sets of data with the same correlation of 0.816

Similar presentations


 DISTRIBUTION>")
 Parameter Estimation of PDF and Fitting a Distribution Function.>")


