Download presentation
Presentation is loading. Please wait.

1
Correlation Patterns

7
Correlation Coefficient A statistical measure of the covariation or association between two variables. Are dollar sales associated with advertising dollar expenditures?

8
The Correlation coefficient for two variables, X and Y is.

9
Correlation Coefficient r r ranges from +1 to -1 r = +1 a perfect positive linear relationship r = -1 a perfect negative linear relationship r = 0 indicates no correlation

10
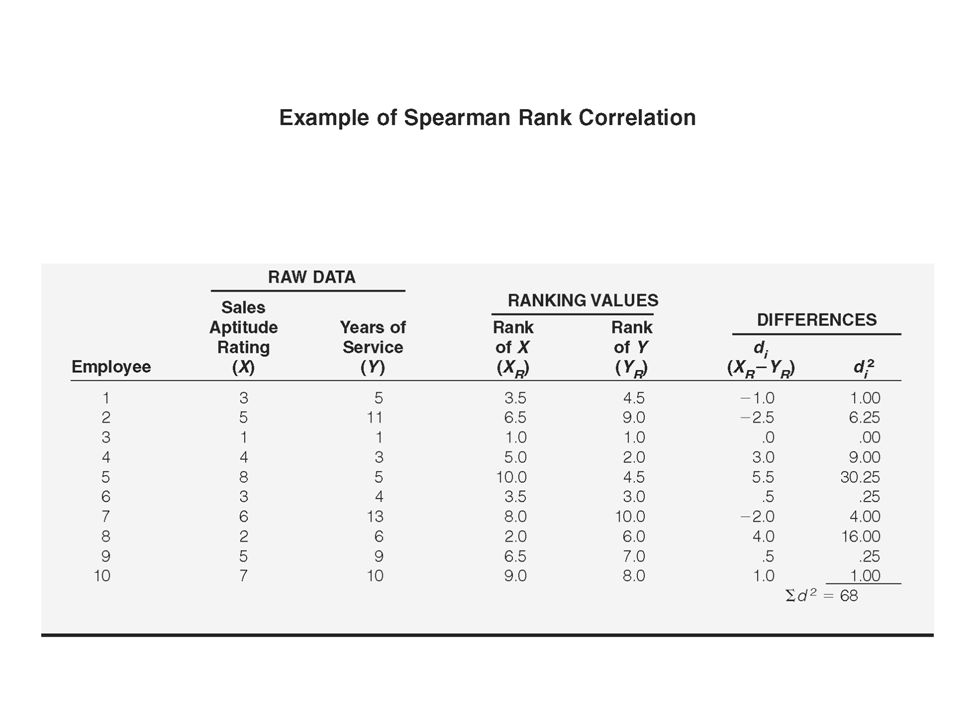
Simple Correlation Coefficient

12
= Variance of X = Variance of Y = Covariance of X and Y Simple Correlation Coefficient Alternative Method

13
Coefficient of Determination

14
Correlation Does Not Mean Causation High correlation Rooster’s crow and the rising of the sun –Rooster does not cause the sun to rise. Teachers’ salaries and the consumption of liquor –Covary because they are both influenced by a third variable

15
Correlation Matrix The standard form for reporting correlational results.

16
Correlation Matrix

18
Type of Measurement Differences between two independent groups Differences among three or more independent groups Interval and ratio Independent groups: t-test or Z-test One-way ANOVA Common Bivariate Tests

19
Type of Measurement Differences between two independent groups Differences among three or more independent groups Ordinal Mann-Whitney U-test Wilcoxon test Kruskal-Wallis test Common Bivariate Tests

20
Type of Measurement Differences between two independent groups Differences among three or more independent groups Nominal Z-test (two proportions) Chi-square test Common Bivariate Tests
 Chi-square test Common Bivariate Tests")
21
Differences Between Groups Contingency Tables Cross-Tabulation Chi-Square allows testing for significant differences between groups “Goodness of Fit”

22
Type of Measurement Differences between two independent groups Interval and ratio t-test or Z-test

23
Differences Between Groups when Comparing Means Ratio scaled dependent variables t-test –When groups are small –When population standard deviation is unknown z-test –When groups are large

24
Null Hypothesis About Mean Differences Between Groups

25
t-Test for Difference of Means

26
X 1 = mean for Group 1 X 2 = mean for Group 2 S X 1 -X 2 = the pooled or combined standard error of difference between means. t-Test for Difference of Means

28
X 1 = mean for Group 1 X 2 = mean for Group 2 S X 1 -X 2 = the pooled or combined standard error of difference between means. t-Test for Difference of Means

29
Pooled Estimate of the Standard Error

30
S 1 2 = the variance of Group 1 S 2 2 = the variance of Group 2 n 1 = the sample size of Group 1 n 2 = the sample size of Group 2 Pooled Estimate of the Standard Error

31
Pooled Estimate of the Standard Error t-test for the Difference of Means S 1 2 = the variance of Group 1 S 2 2 = the variance of Group 2 n 1 = the sample size of Group 1 n 2 = the sample size of Group 2

32
Degrees of Freedom d.f. = n - k where: –n = n 1 + n 2 –k = number of groups

33
t-Test for Difference of Means Example

35
Type of Measurement Differences between two independent groups Nominal Z-test (two proportions)
")
36
Comparing Two Groups when Comparing Proportions Percentage Comparisons Sample Proportion - P Population Proportion -

37
Differences Between Two Groups when Comparing Proportions The hypothesis is: H o : 1 may be restated as: H o : 1

38
or Z-Test for Differences of Proportions

40
p 1 = sample portion of successes in Group 1 p 2 = sample portion of successes in Group 2 1 1 ) = hypothesized population proportion 1 minus hypothesized population proportion 1 minus S p1-p2 = pooled estimate of the standard errors of difference of proportions Z-Test for Differences of Proportions
 = hypothesized population proportion 1 minus hypothesized population proportion 1 minus S p1-p2 = pooled estimate of the standard errors of difference of proportions Z-Test for Differences of Proportions")
42
p = pooled estimate of proportion of success in a sample of both groups p = (1- p) or a pooled estimate of proportion of failures in a sample of both groups n = sample size for group 1 n = sample size for group 2 Z-Test for Differences of Proportions
 or a pooled estimate of proportion of failures in a sample of both groups n = sample size for group 1 n = sample size for group 2 Z-Test for Differences of Proportions")
45
A Z-Test for Differences of Proportions

46
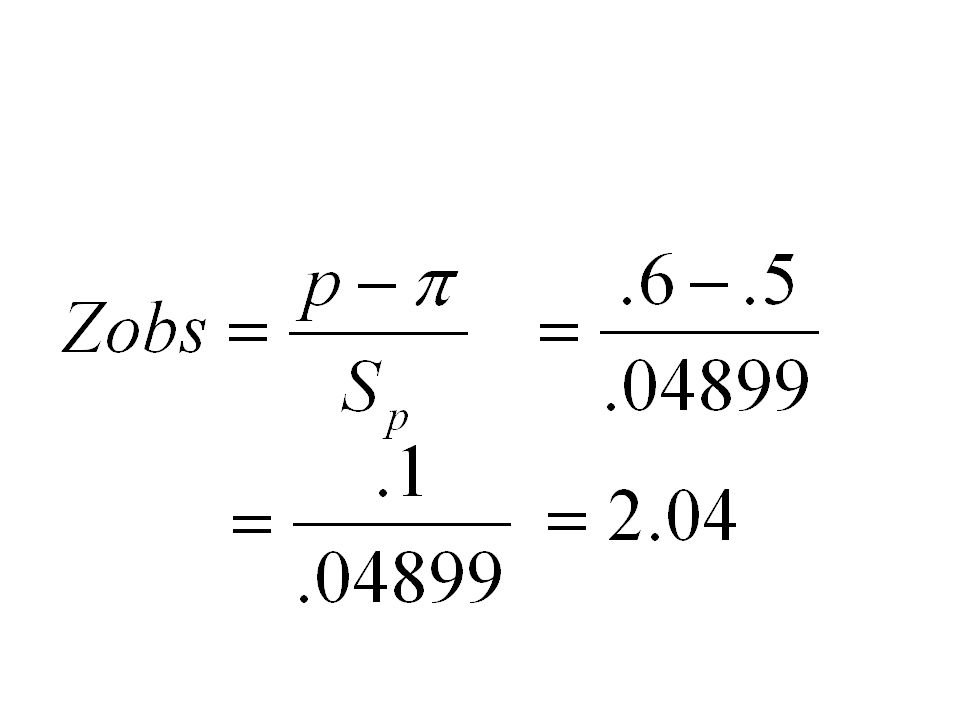
Hypothesis Test of a Proportion is the population proportion p is the sample proportion is estimated with p

47
5. :H 5. :H 1 0 Hypothesis Test of a Proportion

50
0115.S p 000133.S p 1200 16. S p 1200 )8)(.2(. S p n pq S p 20.p 200,1n Hypothesis Test of a Proportion: Another Example

51
Indeed.001 the beyond t significant is it level..05 the at rejected be should hypothesis null the so 1.96, exceeds value Z The 348.4Z 0115. 05. Z 0115. 15.20. Z S p Z p Hypothesis Test of a Proportion: Another Example

Similar presentations


>")


![Hypothesis testing for the mean [A] One population that follows a normal distribution H 0 : = 0 vs H 1 : 0 Suppose that we collect independent.](/16/5187864/big_thumb.jpg "Hypothesis testing for the mean [A] One population that follows a normal distribution H 0 : = 0 vs H 1 : 0 Suppose that we collect independent.>")


