Download presentation
Presentation is loading. Please wait.

1
Developing a Safety Scoreboard Using the Right Metrics

3
Safety Scoreboard Goals 1) Stop hoping your safety program will work, start measuring achievement 1) Stop hoping your safety program will work, start measuring achievement 2) Convince your CEO he / she is measuring the wrong information 2) Convince your CEO he / she is measuring the wrong information 3) Define a process with clear expectations 3) Define a process with clear expectations 4) Establish a process of accountability 4) Establish a process of accountability
 Stop hoping your safety program will work, start measuring achievement 1) Stop hoping your safety program will work, start measuring achievement 2) Convince your CEO he / she is measuring the wrong information 2) Convince your CEO he / she is measuring the wrong information 3) Define a process with clear expectations 3) Define a process with clear expectations 4) Establish a process of accountability 4) Establish a process of accountability")
4
Achilles Heel of Safety Measuring effectiveness is very difficult to quantify Measuring effectiveness is very difficult to quantify –The only indicator of effectiveness is the lack of an unplanned event…(what?) CEO wants to know- CEO wants to know- –How many accidents did you prevent? –How much money did you save?

6
Why do we keep score? Determine if “what we do” is good enough. Determine if “what we do” is good enough. –Did we get the RESULTS we wanted? –Did we our plan work? We have all been trained since childhood… We have all been trained since childhood… –Our youth Star Charts Star Charts Sports Sports Did we win or lose Did we win or lose

7
If we don’t keep score Can you tell the difference between a game and “play” Can you tell the difference between a game and “play” Changes the level of commitment Changes the level of commitment Changes attitude Changes attitude Changes intensity Changes intensity People perform with purpose People perform with purpose

8
Scientific Context The Hawthorne Effect The Hawthorne Effect –Studies of employee motivation 1927- 1932 –Summary: Employee productivity increased because employees were “singled out, involved, and made to feel important.”. –The act of measurement itself impacts the results

9
Hawthorne Studies Hence – Hence – –What receives attention is deemed important –What receives time is deemed important –What is recognized by the organization is deemed important –AND –What is MEASURED---GETS DONE

10
Safety Score? Measures usually based on accidents, which are unplanned. Measures usually based on accidents, which are unplanned. Usually include hindsight, reviewing and comparing year long comparisons Usually include hindsight, reviewing and comparing year long comparisons Lacks antecedents that lead to changes. What drives results? Lacks antecedents that lead to changes. What drives results?

11
Risk Management- What do we measure? Incident rates Incident rates Lost days Lost days DART rates DART rates Industry comparisons Industry comparisons Experience Modifier Experience Modifier Cost comparisons Cost comparisons

15
Managing Risk If the goal is to manage risk and ultimately decrease injuries and reduce cost then it must be managed. If the goal is to manage risk and ultimately decrease injuries and reduce cost then it must be managed. You cannot manage what you do not measure. You cannot manage what you do not measure. What you measure must directly influence results. What you measure must directly influence results.

16
Managing Risk Safety needs to be intentional Safety needs to be intentional Achievement oriented Achievement oriented Measureable (but what do you measure?) Measureable (but what do you measure?) Identified management accountability Identified management accountability Included on performance reviews Included on performance reviews Recognized by management as part of the process Recognized by management as part of the process
 Measureable (but what do you measure ) Identified management accountability Identified management accountability Included on performance reviews Included on performance reviews Recognized by management as part of the process Recognized by management as part of the process")
17
The Problem CEOs expect results CEOs expect results But…results are lag measures. But…results are lag measures. Safety is in the middle, experimenting. Safety is in the middle, experimenting. –Training and re-training –Safety committees that are not effective –Feel unable to change the culture –Feel it is “unfair” to judge them on subordinates performance

18
Results vs. Activities Results Activities By: Dan Peterson

19
Lead Indicators Lead indicators are: Lead indicators are: –Actionable today—did you do it or not? –Measurable –Observable Lead indicators INFLUENCE the lag measures. Lead indicators INFLUENCE the lag measures. Leads are a bet that if we do “x” then “y” will improve Leads are a bet that if we do “x” then “y” will improve

20
Progress W. Edwards Deming: W. Edwards Deming: –96% of our issues are from “How operations are run” –4% of issues are from people Operations are often left out of the formula because we focus on people. Operations are often left out of the formula because we focus on people.

23
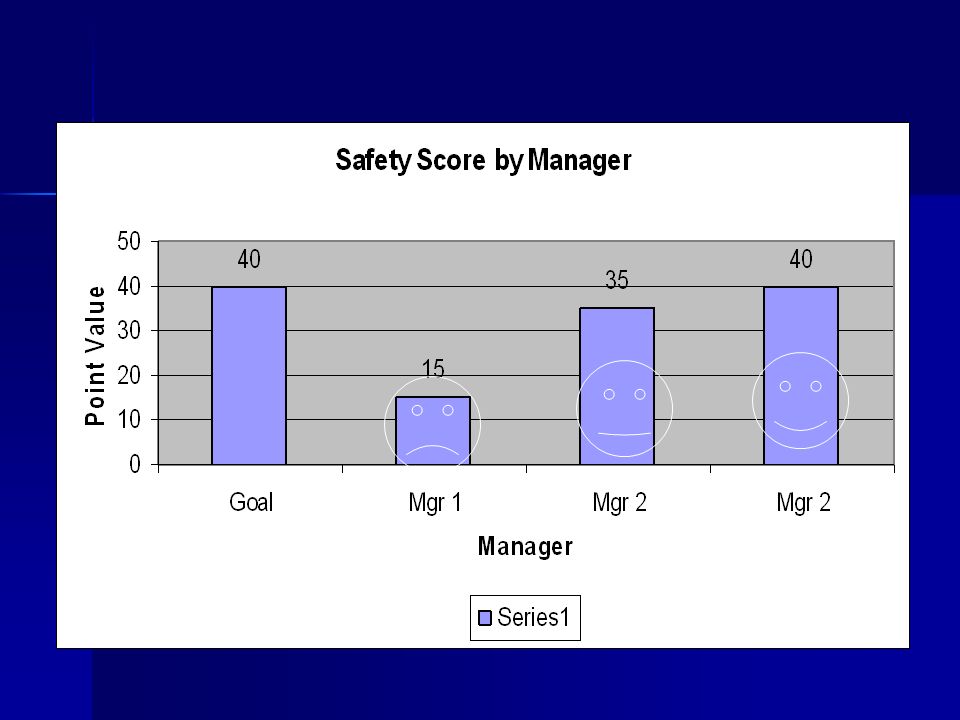
Accountability Items Item Pt. Value Mgr. 1 Mgr. 2 Mgr. 3 Clean 2 times / shift 1051010 100% PPE Use 1001010 Weekly equip. insp. 1051010 5 safety 1 on 1s /wk 105510 Total40153540

25
Complaints… I don’t have time I don’t have time Too busy Too busy Not important today Not important today If it is deemed important by the CEO it will get done. If it is deemed important by the CEO it will get done. This is a change, expect resistance This is a change, expect resistance

27
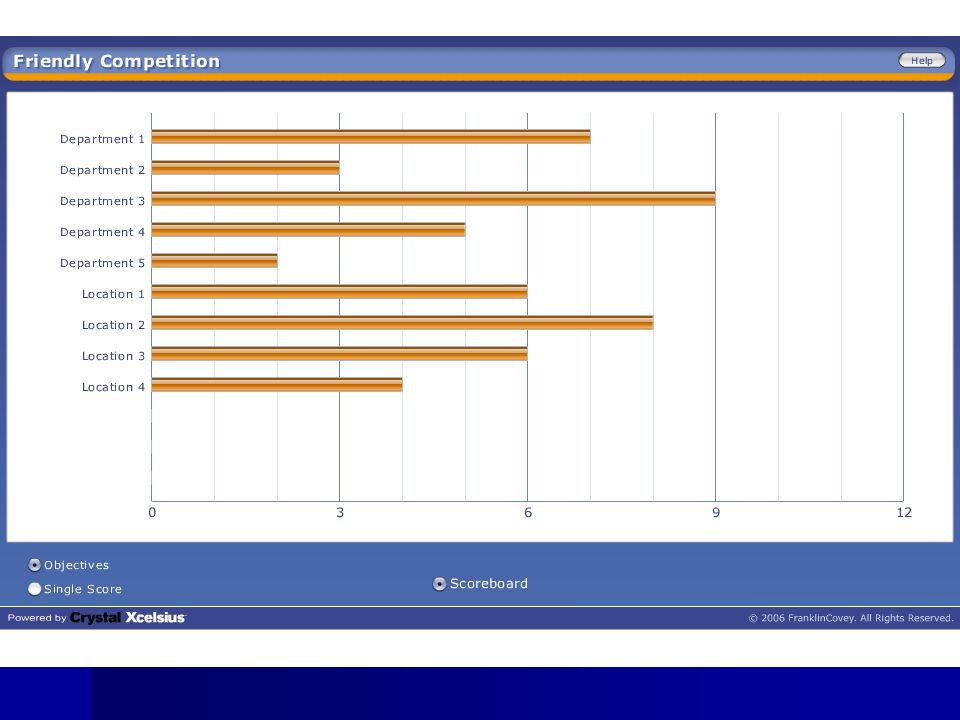
A note about scoreboards Keep it SIMPLE…did you win or not? Keep it SIMPLE…did you win or not? Post it in a noticeable area Post it in a noticeable area Be creative Be creative

28
Make it clear…

29
Loss Prevention Risk Alert Actions: Risk Alerts Contacted within 7 days Goal= 100% As of 4/15/09

30
Claims: Yellow Flag Action 100% Acted Upon within 14 days As of 5/8/09

32
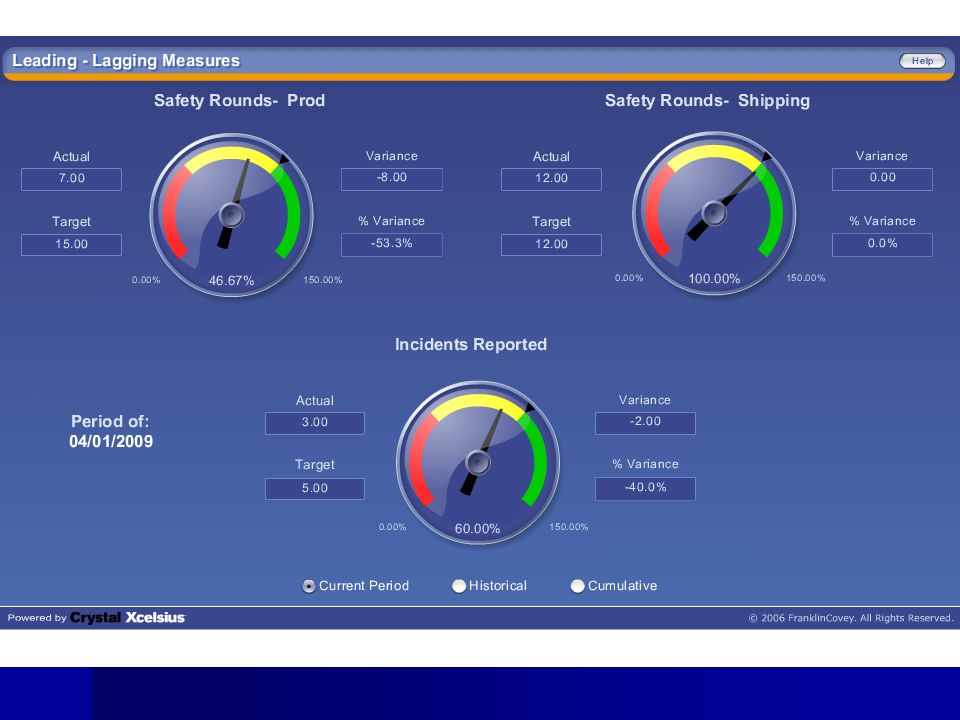
Incidents AND Observations

33
Safety Observations by Department

35
Scoreboards Decide the key activities that will influence the lag measures Decide the key activities that will influence the lag measures Measure activities and effectiveness Measure activities and effectiveness Tie rewards / recognition to completion of activities Tie rewards / recognition to completion of activities Use scoreboards to improve accountability Use scoreboards to improve accountability

36
Thank you!

Similar presentations


 Presented by Chris Lease, Safety Director.>")


