Download presentation
Presentation is loading. Please wait.

1
Illinois Energy Careers Graphs Summary Employment and Wage Data provided by Illinois Pathways July 2013

2
Highest Paying Careers (by Median Annual Wage) ……………………………..…….. Existing Careers (Employment in 2010) ……………………………………………….....… Fastest Growing Careers (Average Annual Job Openings due to Growth)..... Careers by Increasing Employment (Employment Change in 2010) ……….…… Percentage Growth (Employment Percentage Change 2010-2020) ………....… Replacement Careers (Annual Job Openings Due to Replacement) ……….….. Industries (With the Greatest Direct Employment Impacts) ………………….….. Compensation (Average Direct Employment Compensation) ………….…….….. Table of Contents 3 10 15 20 25 30 37 39 Page Graphs
 ……………………………………………….....… Fastest Growing Careers (Average Annual Job Openings due to Growth)..... Careers by Increasing Employment (Employment Change in 2010) ……….…… Percentage Growth (Employment Percentage Change ) ………....… Replacement Careers (Annual Job Openings Due to Replacement) ……….….. Industries (With the Greatest Direct Employment Impacts) ………………….….. Compensation (Average Direct Employment Compensation) ………….…….….. Table of Contents Page Graphs.")
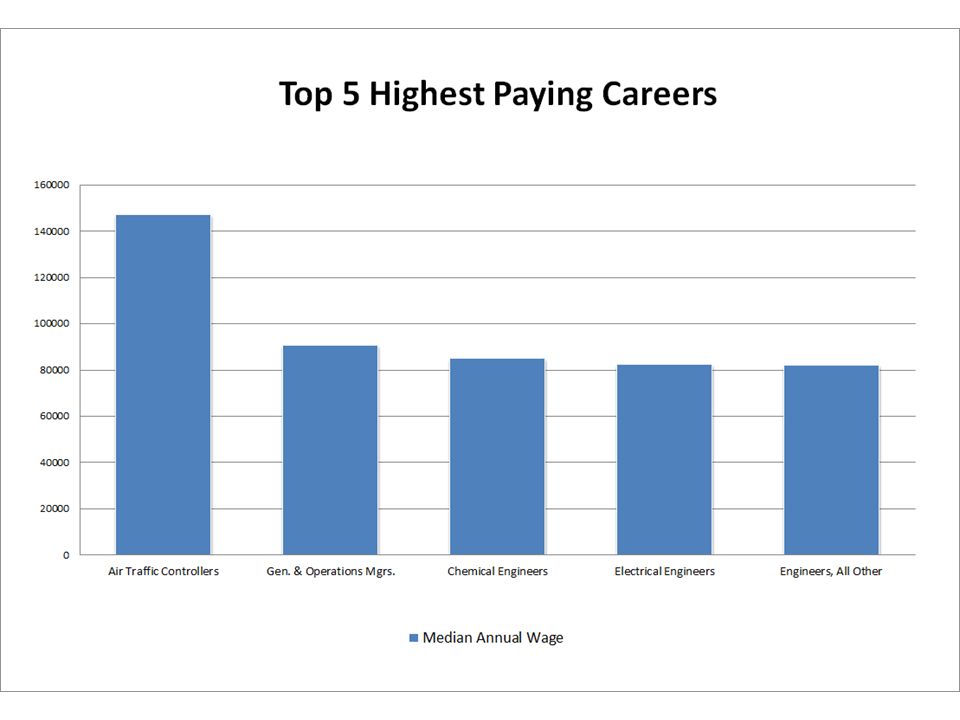
3
Highest Paying By Median Annual Wage

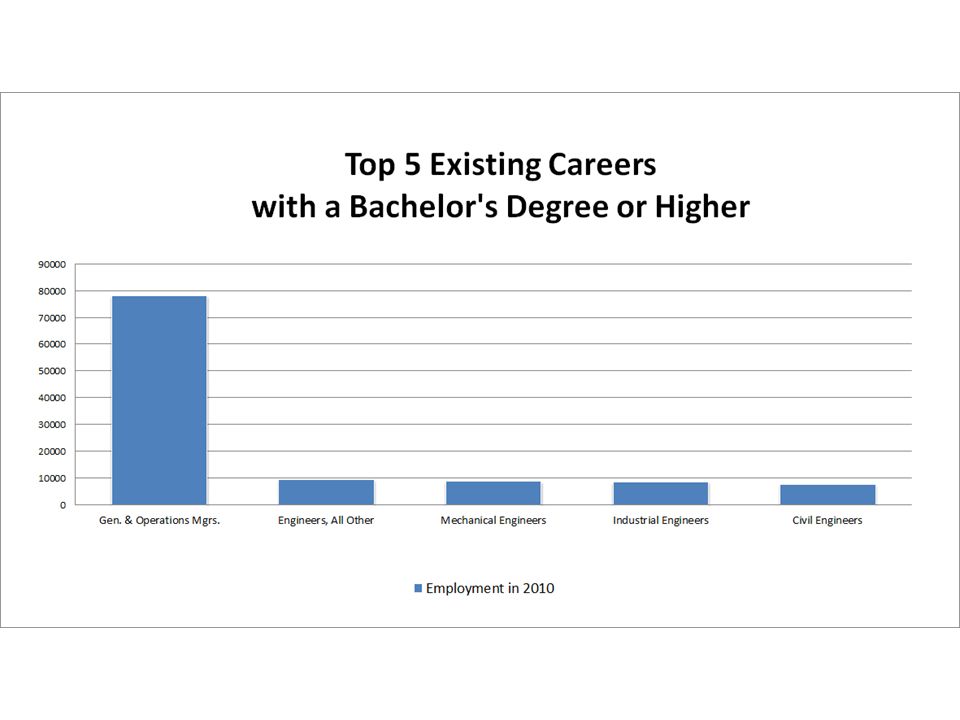
10
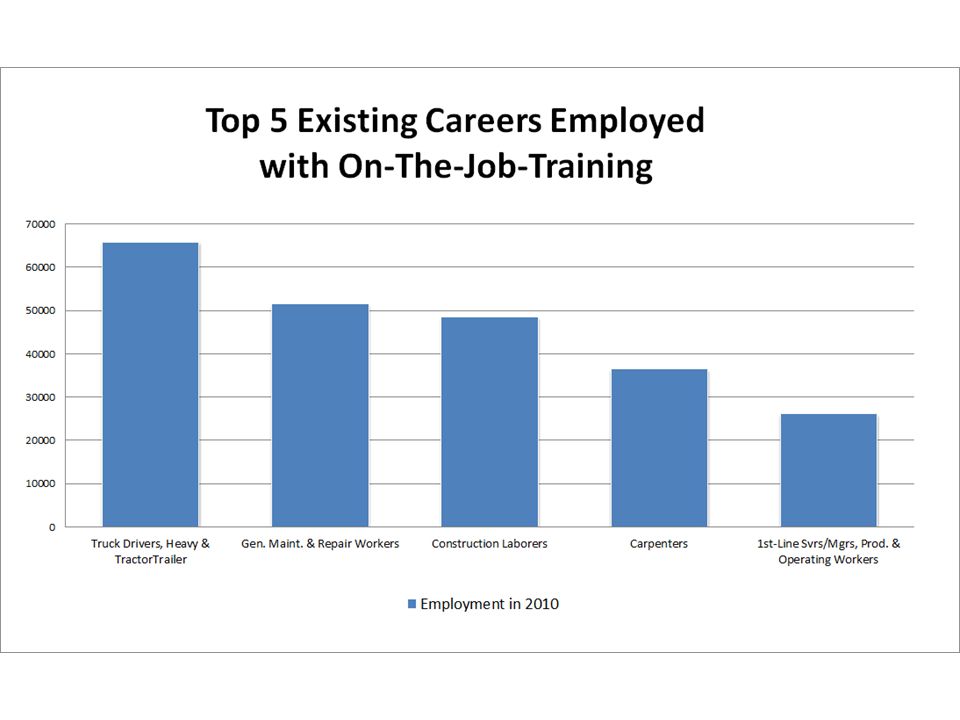
Existing Careers Employment in 2010

15
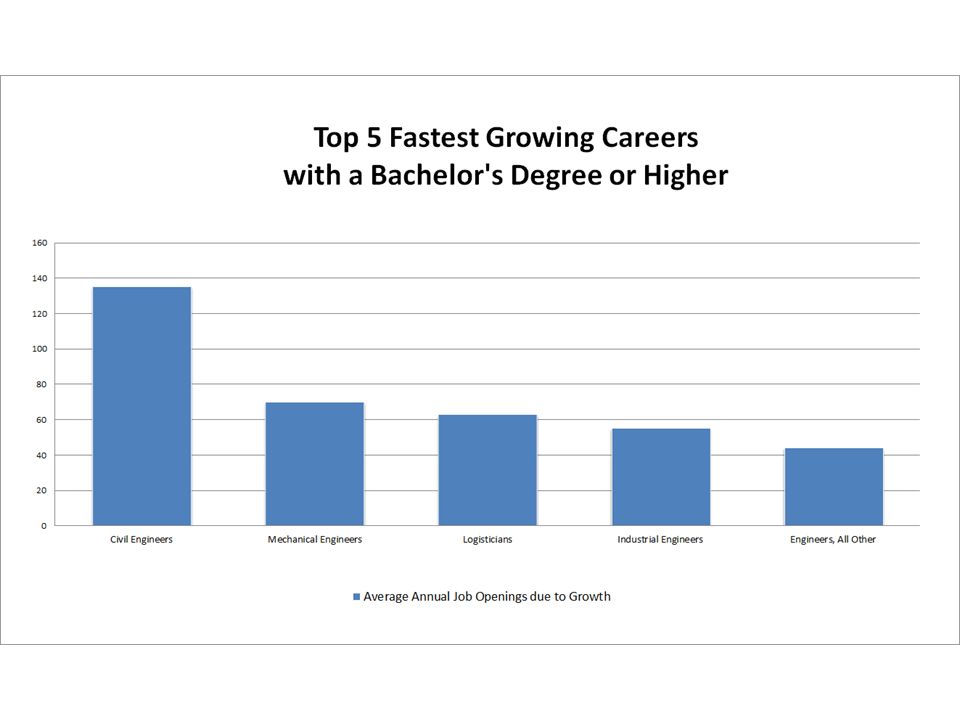
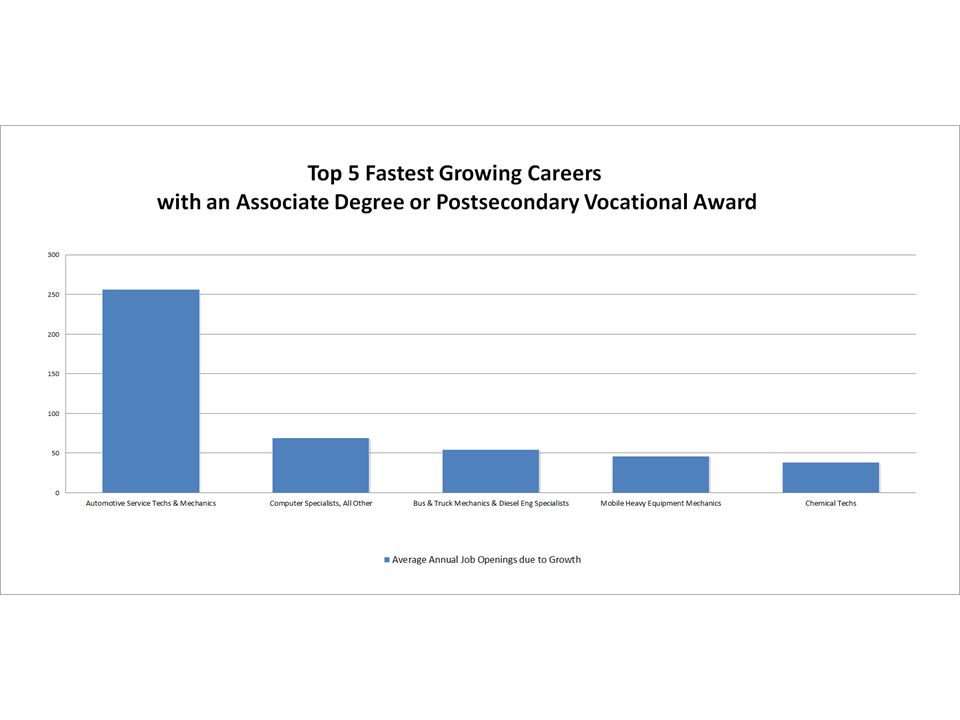
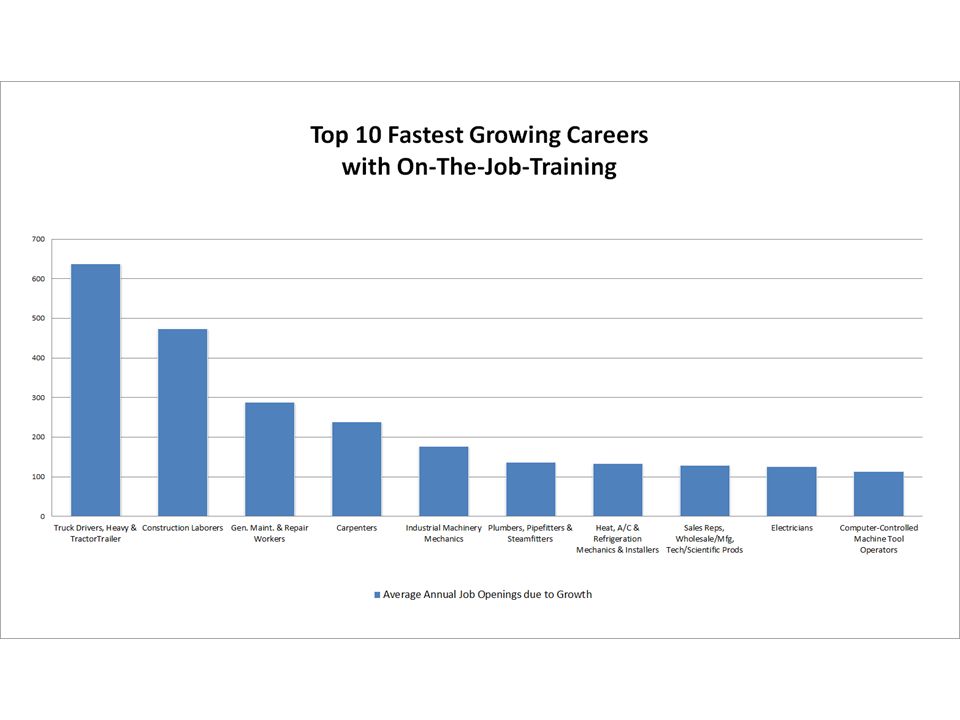
Fastest Growing Careers Average Annual Job Openings Due to Growth

20
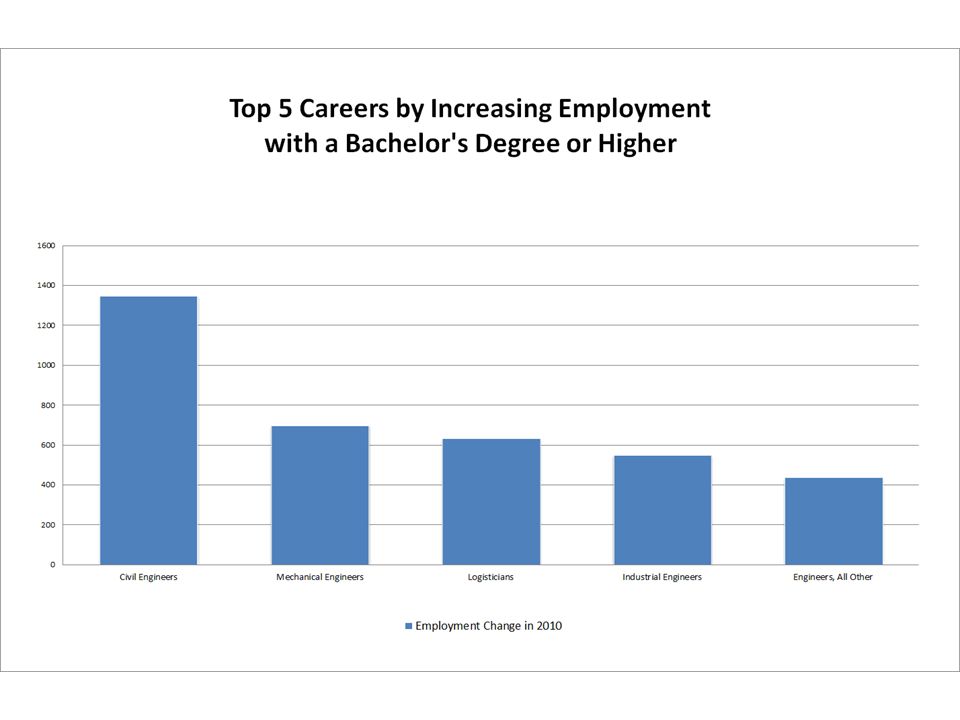
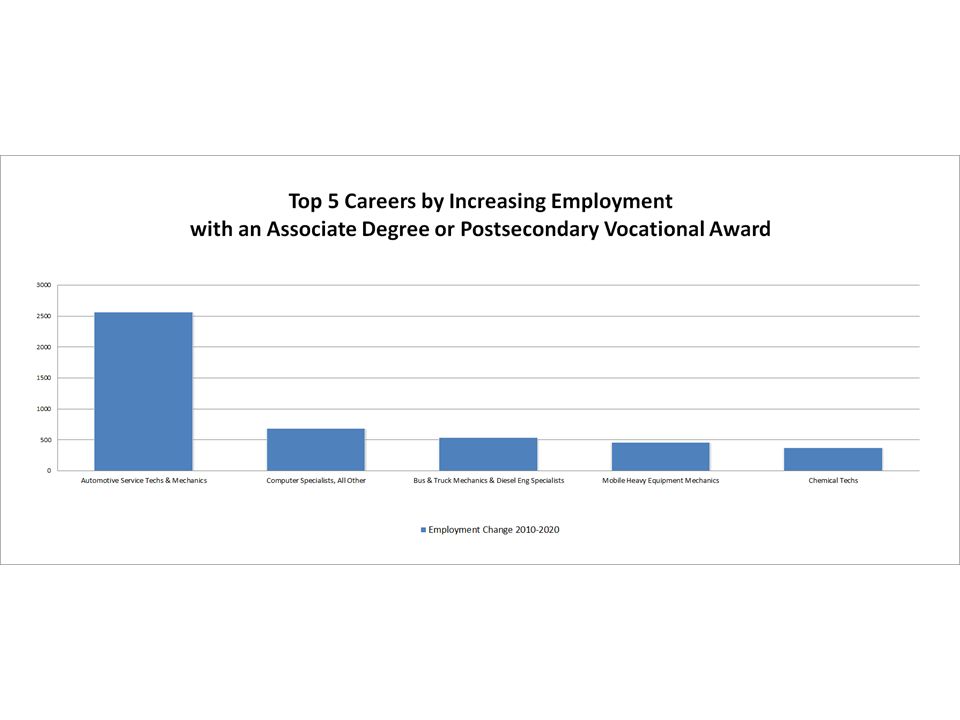
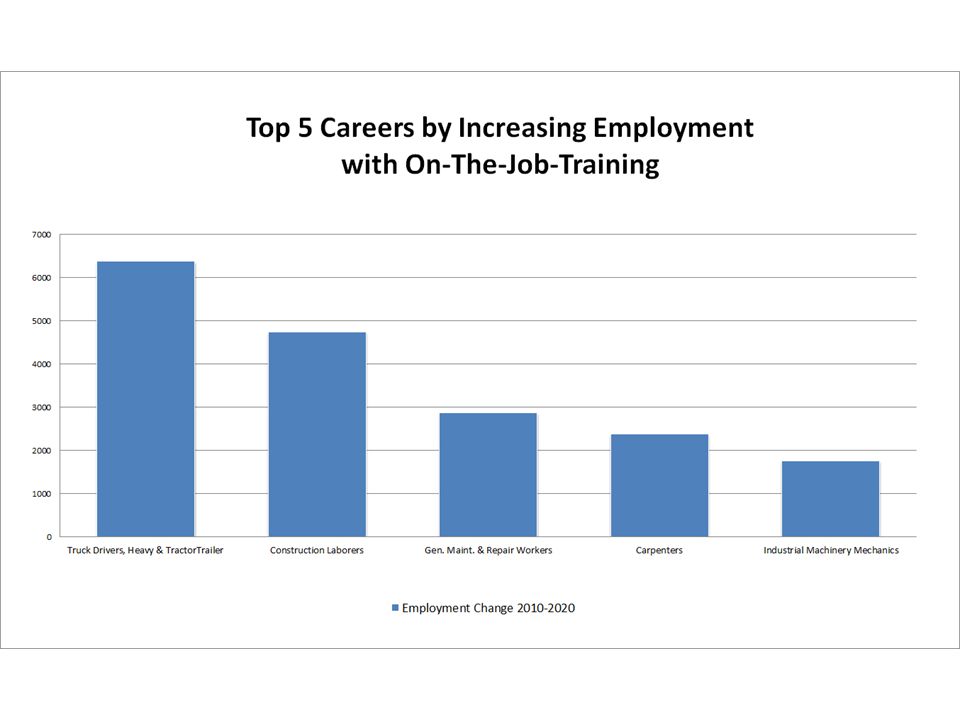
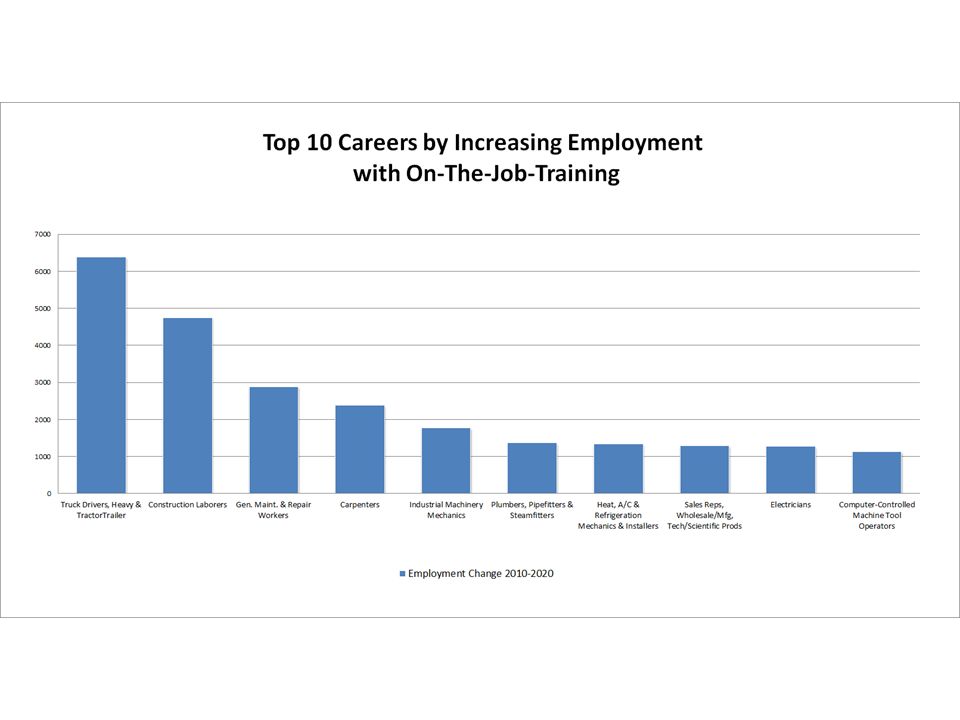
Increasing Employemnt Employment Change in 2010

25
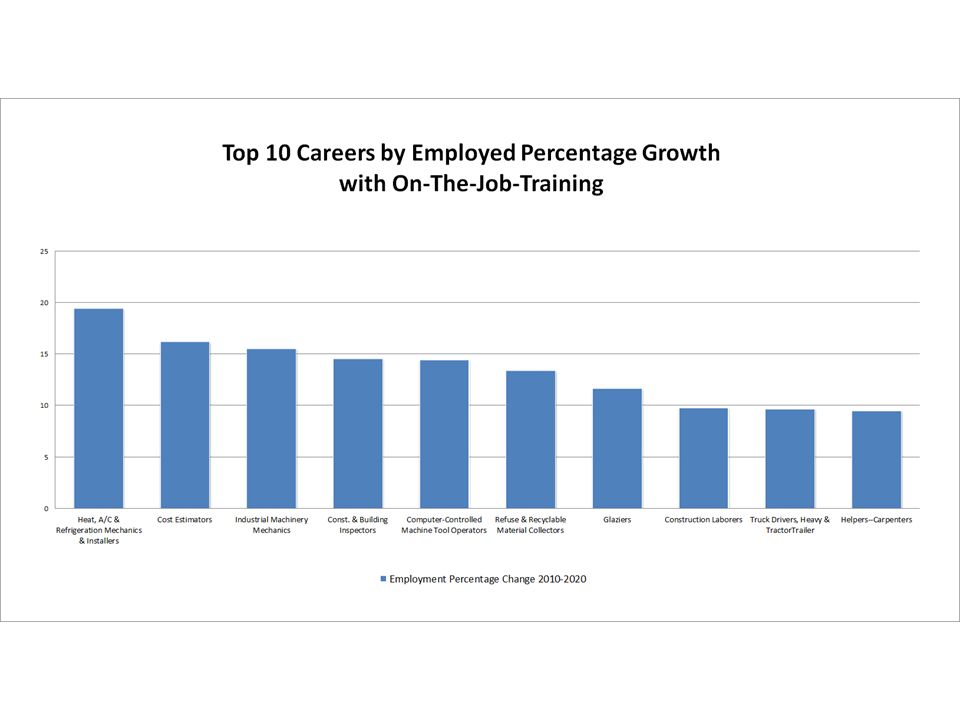
Percentage Growth Employment Percentage Change 2010 - 2020

30
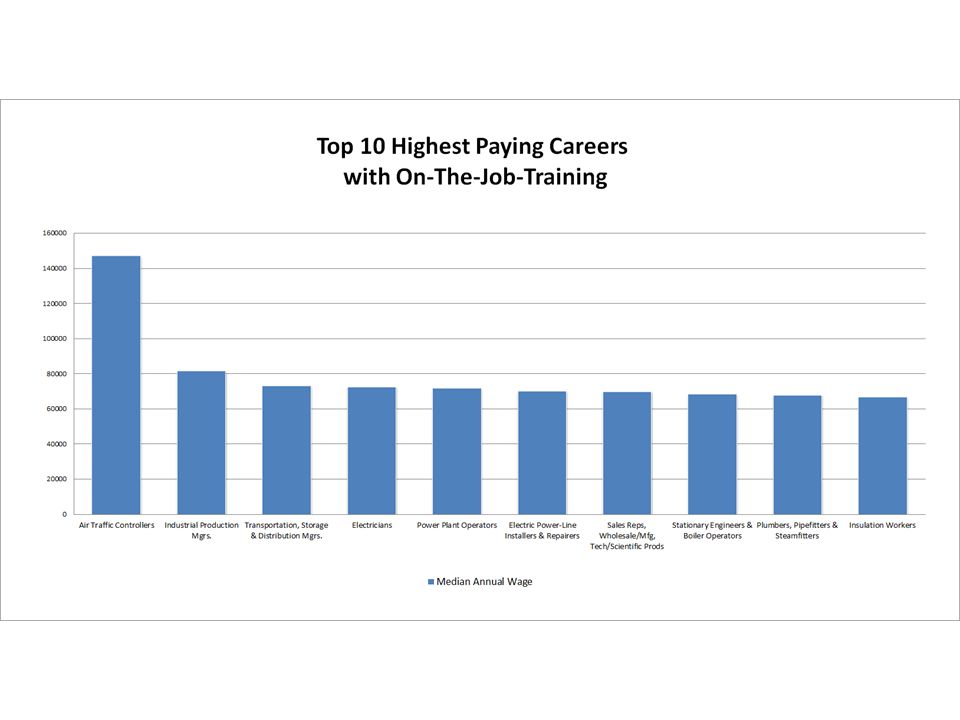
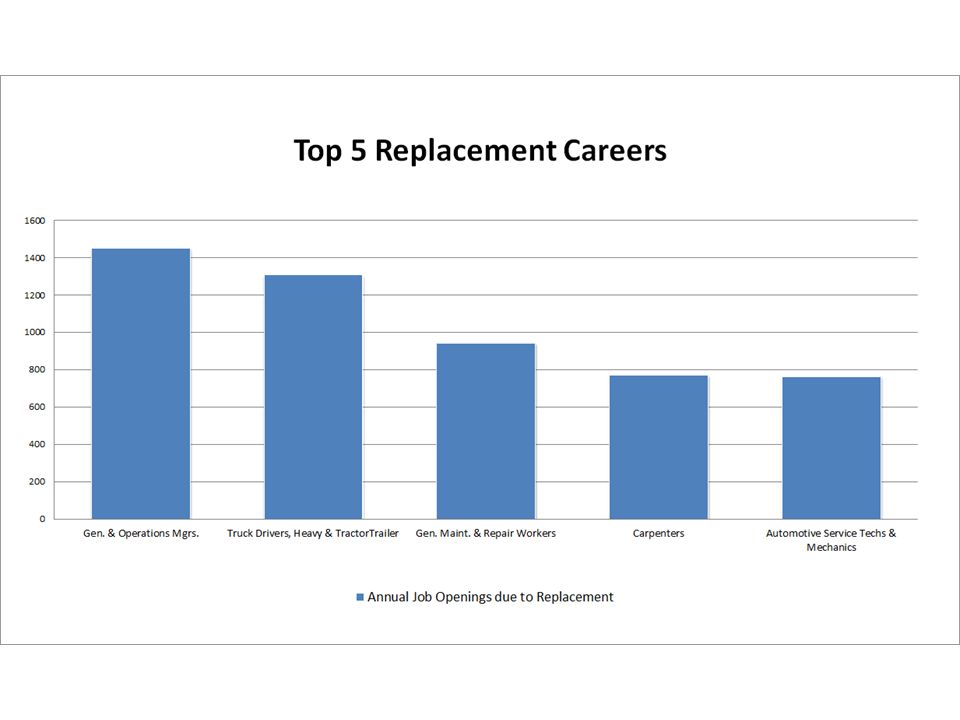
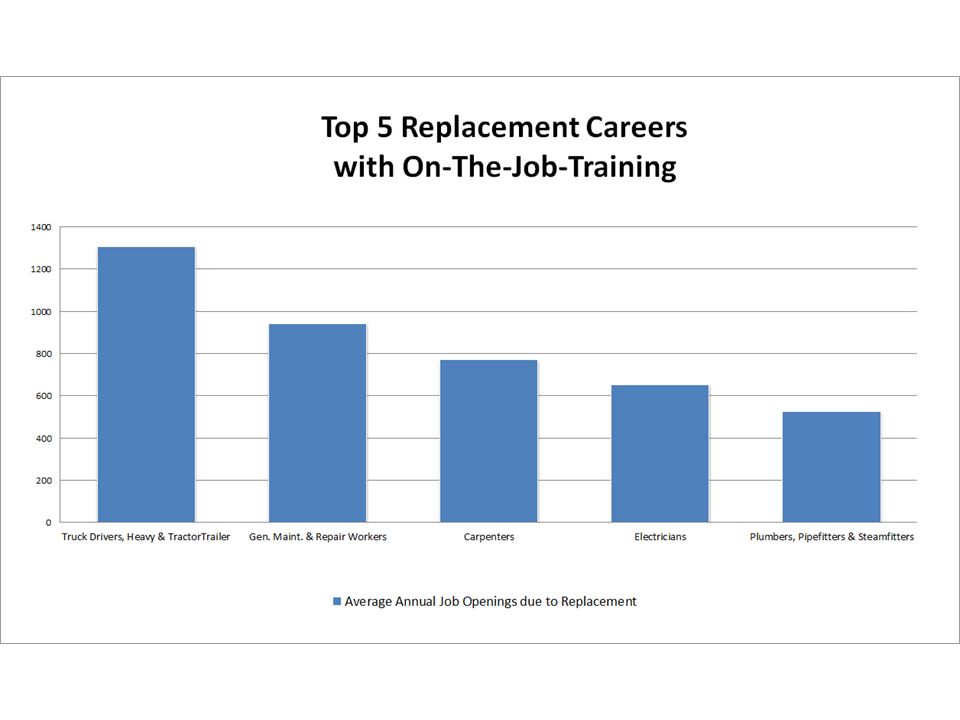
Replacement Careers Annual Job Openings Due to Replacement

37
Industries With the Greatest Direct Employment Impacts

39
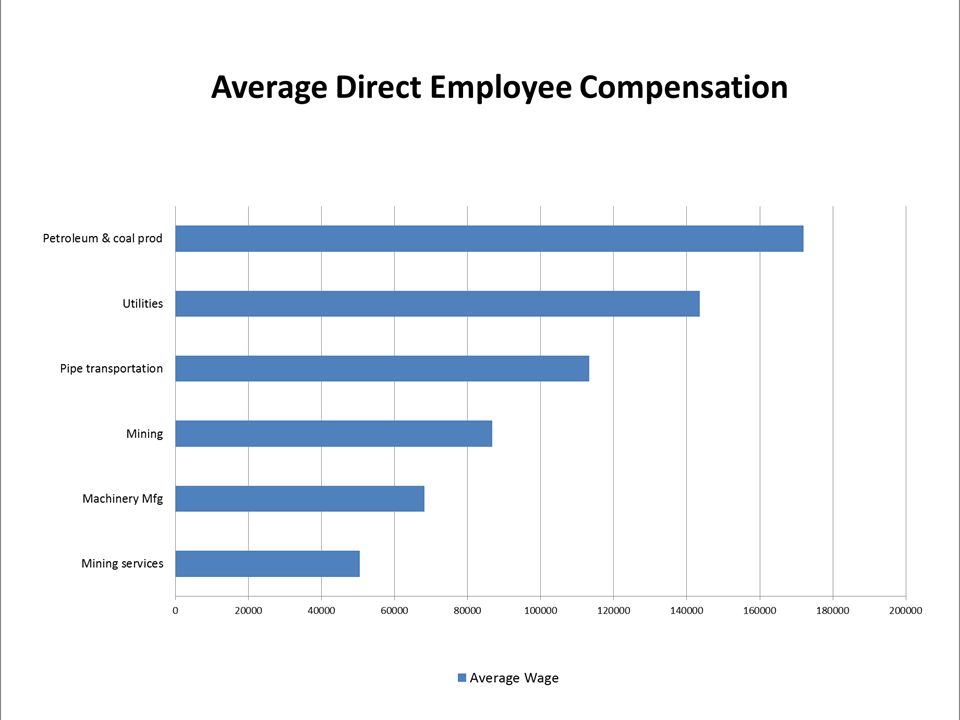
Compensation Average Direct Employee Compensation

Similar presentations


increase your awareness of the breadth of opportunities in STEM careers for all students,>")


 Where we’ve been; where we’re going. Kara Markley Regional Economist U.S. Bureau of Labor Statistics July.>")

