Download presentation
Presentation is loading. Please wait.

1
Remote Sensing in Geology

2
Highlights of Lesson 9 Criteria: Geomorphological Tone & color Vegetation Derived criteria Surveying Geology: Structures: − Rupture elements (beddings, faults, joints) − Plicative elements (anticlines, sinklines) Lithological units Quaternary units
 − Plicative elements (anticlines, sinklines) Lithological units Quaternary units")
3
Lesson № 10

4
Intro: Multispectral approach of satellite born systems proved to be advantageous over aerial photo interpretations even coarser in resolution and limited in stereoscopy. Namely, the structural features appeared more discernable in synoptic view (instead of mosaicing far too many aerial photos), not to mention the benefits of spectral information boost in color composites. The case histories showed immense contributions in exploration of metallic and non-metallic mineralizations, as well as construction material deposits. Non renewable resources (especially hydrocarbons) appeared to be cyclically assessed by RS, based on their actual demands on the market… In turn, the indirect approach was substantially popularized, since it seemed to be easier and more reliable to map rocks and minerals associated with the ore body then the body itself (ore were not find as spectrally unique, even more so, they are rarely exposed and indicated on the surface). Geological applications – Mineral mapping
, not to mention the benefits of spectral information boost in color composites. The case histories showed immense contributions in exploration of metallic and non-metallic mineralizations, as well as construction material deposits. Non renewable resources (especially hydrocarbons) appeared to be cyclically assessed by RS, based on their actual demands on the market… In turn, the indirect approach was substantially popularized, since it seemed to be easier and more reliable to map rocks and minerals associated with the ore body then the body itself (ore were not find as spectrally unique, even more so, they are rarely exposed and indicated on the surface). Geological applications – Mineral mapping.")
5
Metallic deposits Copper (Cu) Gold (Au) Hydrocarbon deposits Geological applications – Mineral mapping
 Gold (Au) Hydrocarbon deposits Geological applications – Mineral mapping")
6
Porphyry copper deposits claim their domination in terms of Cu findings (by volume and purity of the ore). They are emplaced within the active convergent continental margins (subduction zones) and provoked by both crustal and upper mantle magmas. As such they represent vast linear features, affecting and altering the surrounding rocks zonally trough their evolution. A typical cross- section consists of the alteration zones (propylitic, argillic & phyllic), shelled coaxially around the potassic (K) core, where a usual ore shell embraces the contact zone (core vs. phyllic alteration zones with pyrite, molybdenite & chalcopyrite compounds in abundance), whereas oxidized shells (containing ferric oxides) predominantly shift toward the outermost periphery of alteration zone.subduction zones Copper deposits
 and provoked by both crustal and upper mantle magmas. As such they represent vast linear features, affecting and altering the surrounding rocks zonally trough their evolution. A typical cross- section consists of the alteration zones (propylitic, argillic & phyllic), shelled coaxially around the potassic (K) core, where a usual ore shell embraces the contact zone (core vs. phyllic alteration zones with pyrite, molybdenite & chalcopyrite compounds in abundance), whereas oxidized shells (containing ferric oxides) predominantly shift toward the outermost periphery of alteration zone.subduction zones Copper deposits.")
8
tuff silificated argillic opalized

9
Copper deposits vis - swir, nir swir - nir

10
Copper deposits Quantitative approach brightness/ratio codes: Average the reflectance for TM data records (about 150 mineral/vegetation specimens) Calculate all the ratio image combinations (non-repetitive) Normalize to entire data base Reclassify for 10-grade scale (0 for no reflectance and 9 for maximal) Inversed ratio codes are obtained by subtracting from 9 Alunite – high reflectance in bands 3 & 4, low in 7
 Calculate all the ratio image combinations (non-repetitive) Normalize to entire data base Reclassify for 10-grade scale (0 for no reflectance and 9 for maximal) Inversed ratio codes are obtained by subtracting from 9 Alunite – high reflectance in bands 3 & 4, low in 7")
11
Copper deposits

12
Color Ratio Composite: R = 5/7 G = 5/1 B = 3/4 Clayey minerals are having high red ratio so they are displayed in red Ferric compounds (hematite, goethite, limonite) are displayed green due to high 5/1 ratio code and negligible in red and blue Transitions are represented by yellow and dark colors
 are displayed green due to high 5/1 ratio code and negligible in red and blue Transitions are represented by yellow and dark colors")
13
Copper deposits tuff silificated low Fe and clay argillic high clay & Fe opalized high clay & low Fe

14
Especially interesting for disseminated deposits Tracked by some spectrally authentic mineral specimens, such as buddingtonite (in sparsely vegetated terrain) by same principle of ratio CC. Buddingtonite is ammoniated feldspar in hydrothermally altered rocks. It is exhibiting some interesting spectral features around its apsorption line in NIR Gold deposits

15
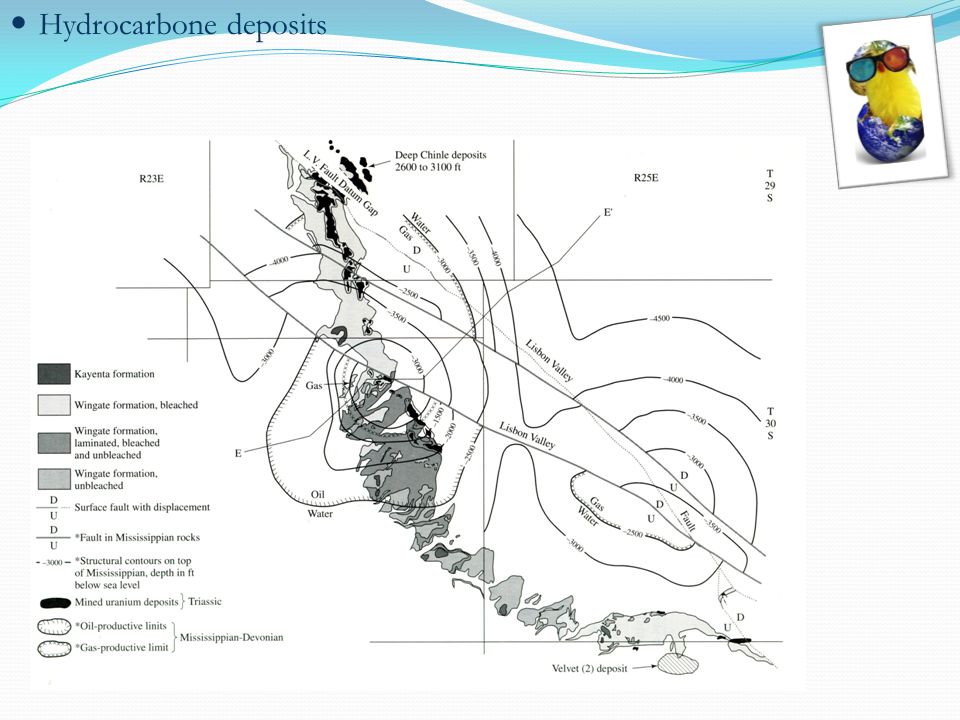
Hydrocarbons are represented by natural gas and oil deposits generated by decaying of organic matter. Once they are trapped within some geological structural feature they are accumulated. One way of dealing with the exploration is to track those structural features Another implies delicate multispectral analyses of deposit vs. base rock interplay. Namely, the “trap” requires saturated environment, isolated to a specific level, but some seepage is unavoidable. The molecules of gas are penetrating the barriers trough the micro-fissures or readily developed cracks & joints, upward, pressured by the lithostatics. The gas compounds react with the overlain environment chemically, bleaching the rocks and leaving some significant geochemical imprints, such as uranium ore cells. Hence, it is possible to conduct indirect mapping of the petroleum deposits trough uranium exploration On the other hand uranium exploration could be derived directly (measuring the radioactivity) or again indirectly by tracking the oxidation zone (alike the copper exploration) Hydrocarbone deposits
 or again indirectly by tracking the oxidation zone (alike the copper exploration) Hydrocarbone deposits.")
18
MSS ratio 5/4 (TM ratio 2/1)
")
19
Hydrocarbone deposits CRC (MSS converted to TM) R = 2/1 G = 3/2 B = 4/3 reddish areas are heavily ironed green-blue areas are vegetated water & shades are black
 R = 2/1 G = 3/2 B = 4/3 reddish areas are heavily ironed green-blue areas are vegetated water & shades are black")
20
Hydrocarbone deposits FCC R = 2 G = 3 B = 4 vegetation is red

21
Hydrocarbone deposits Supervised classification by parallelepiped method: Triassic – red Shale – blue Arkose sandstone – black Limestone & Granit - brown

Similar presentations


 AND REMOTE SENSING Lecture 4 Zakaria Khamis.>")


