Download presentation
Presentation is loading. Please wait.

1
DEMOGRAPHIC DEVELOPMENT: THE CHALLENGES OF GLOBALIZATION (The Seventh Valenteevskiye Chteniya) 15-17 November 2012 Lomonosov Moscow State University The ethnic transformation of European societies by immigration David Coleman, University of Oxford david.coleman@spi.ox.ac.ukavid.coleman@spi.ox.ac.uk http://www.spi.ox.ac.uk/oxpop
 November 2012 Lomonosov Moscow State University The ethnic transformation of European societies by immigration David Coleman, University of Oxford")
2
Immigration and the rise of ethnic minority populations in Europe. Historically, Europe a region of emigration. Large-scale immigration in peacetime mostly from 1960s: Guest-workers to some countries Easy entry from former colonies – for a time. Subsequent entry of dependants and new spouses Chain migration from non-European countries helped by ‘familist’ culture, large family size, revolutions in information, transport, rights. EU expansion Renewed recent interest in skilled migration Policy important but erratic; many now restrictive

3
Some facilitating factors for migration Unequal pace of economic development and demographic transition in ‘North’ and ‘South’. Geographical proximity. Political / historical connections. Post-war ‘revolutions’ in transport, information and rights. State policy in sending and receiving countries. Voting power of immigrant minorities International conventions. The ‘migration industry’ and trafficking. Factors reducing migration pressure.

4
Turkey and Western Europe

5
Migration flows to European Union and USA, 1960 – 2011 (thousands)
")
6
Gross migration flow to France 2005, by reason for admission (%).
.")
7
Long-term migration trends to the United Kingdom 1967 – 2011, UK and non-UK citizens.

8
Net migration to selected European countries 1997 – 2011

9
Net migration to Italy and Spain 1997 – 2011. Note: increase primarily due to illegal immigration and regularisation of illegal residence through amnesties.

10
Migration can go down as well as up. Germany 1954 – 2007.

11
Ethnic change Continued migration from one population, into another with sub-replacement fertility, must eventually replace one with the other. If incoming populations have higher fertility, the process will be accelerated. Migration, not differential fertility, is usually the dominant factor in ethnic transition.

12
Estimates of foreign origin and immigrant population, selected European countries. Sources: national statistical offices

13
Selected European populations, percent of residents born abroad, 2010. Source: Eurostat

14
Relative size of live births and natural increase in 2010, selected countries

15
Special features of migration to the former Soviet Union Russian Empire / Soviet Union / Russian Federation facilitated internal migration and creation of minority populations. International migration minimal from 1920s ‘Return’ migration of Russian nationals from 1992 Recent large-scale migration of non-Russians from ‘near abroad’ and China, regular and irregular. Foreign citizen population now 8.7%

16
TFR trends of UK ethnic minority populations 1965 – 2006 data from Labour Force Survey by own-child method, 7-year moving averages

17
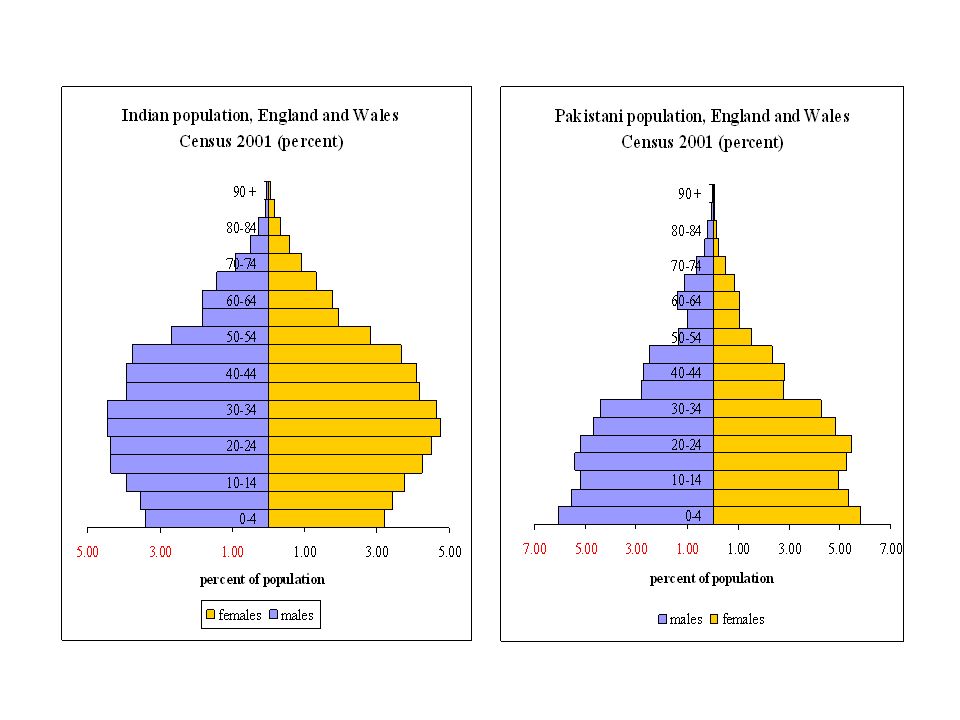
Convergence in fertility: total fertility of Pakistani women in the UK by birthplace. Source: Coleman and Dubuc 2010.

19
Ethnic change in the USA, projected 1999 - 2100 (thousands)
")
20
A projection of ethnic transformation in the UK 2006 – 2056. TFR = 1.84, net immigration = 180,000 / year. Source: Coleman 2010.

21
Sweden 1980 – 2020. Foreign-born and ‘foreign origin’ population, as percent of total population.

22
Comparison of results of ‘foreign-origin’ or ‘ethnic minority’ projections in Western countries

23
UK population projection 2051 by age, sex and origin Assumptions for total population as GAD Principal Projection 2006 (net migration 190K; TFR 1.84)
")
24
Other transformations: ethnic groups of mixed origin, England and Wales 2001(thousands). Source: 2001 Census.

25
The faces of the future?

27
An end to ‘ethnic’ categories? The rise of mixed populations. Probabilistic projections of the UK 2001- 2100, average outcome for major groups (percent).
..")
28
Projected growth of ethnically mixed population in the absence of migration, UK 2006 – 2056.

29
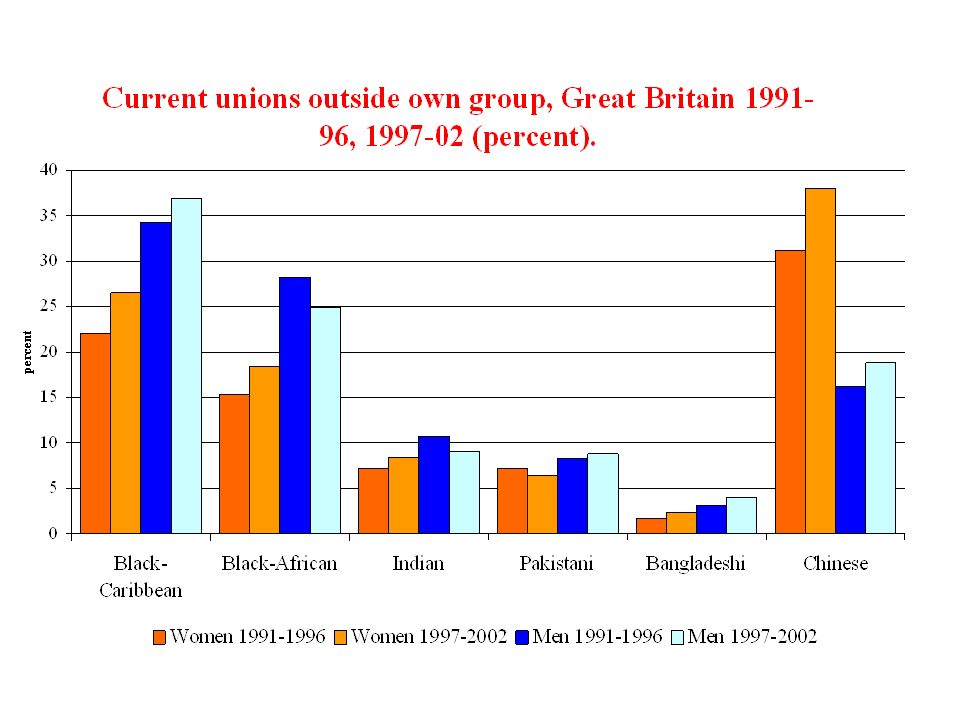
Concluding points on ethnic change Migration from developing world may be over within a century (?); but effects on ancestry permanent. Migration the key driver; in theory under policy control. An inevitable consequence of globalisation? Significance for social and political change: religion, identity, segregation, language, law, foreign policy? (depends on numbers, pace, origins, policy). Integration / assimilation, or ‘community of communities’? And who adapts to whom? Inter-ethnic union may change relative group size, eventually create a completely new mixed population.
. Integration / assimilation, or ‘community of communities’. And who adapts to whom. Inter-ethnic union may change relative group size, eventually create a completely new mixed population..")
Similar presentations
 decline in.>")


 Jon Simmons Deputy Director (Migration and Border Analysis)>")


 Olga Chudinovskikh Moscow State Lomonosov University.>")


