Download presentation
Presentation is loading. Please wait.

1
Stream Quality Assessment Biological Monitoring

2
WHY Monitor Stream Quality? To determine if problems exist in our streams and rivers.

3
HOW do we Monitor Stream Quality? Stream quality can be assessed by determining the kinds of animals that live within the stream (Biotic Assessment) Other indicators may be stream odor, appearance, and surroundings (Abiotic Assessment)
 Other indicators may be stream odor, appearance, and surroundings (Abiotic Assessment).")
4
Biotic Assessment Seines may be used to collect stream inhabitants Group members can help to dig up critters to be caught in the seine, by scraping rocks or shuffling their feet

5
What kind of critters do we look for? Macroinvertebrates “Macro”= large enough to be seen with the naked eye “Invertebrate” = without a backbone Aquatic macroinvertebrates can be indicators of water quality

6
There are 3 groups of Macroinvertebrates: Group One Taxa – pollution sensitive organisms; if these critters are present, you have little pollution in the water Group Two Taxa – moderate pollution- tolerant; these guys may indicate that the water has some pollution, but not a lot of pollution. Group Three Taxa – heavy pollution-tolerant; these critters may indicate very heavy pollution

7
Group One Taxa Pollution sensitive organisms found only in high quality water

8
Stonefly Nymph 1/2” - 1 1/2” in length 6 legs with hooked tips Long antennae 2 hair like tails

9
Mayfly Nymph 1/4”-1” in length 6 large hooked legs Plate-like gills on sides of body Many long feelers on lower half of body Antennae 2 to 3 long, hair-like tails

10
Water Penny Beetle Larvae 1/4” in length 6 tiny legs on bottom side of body Flat, saucer-shaped body with raised bumps on top side of body

11
Gilled Snail Shell opens on the right Opening covered by thin plate called operculum

12
Caddisfly Larvae Up to 1/2” in length 6 hooked legs on upper third of body 2 hooks at back end May be found in rock, stick, or leaf case Typically greenish colored body with dark head

13
Dobsonfly Larvae (Hellgrammite) 3/4” - 4” in length 6 legs Many feelers on lower half of body 4 hooks at back end Fan shaped gill tufts on sides Short antennae
 3/4 - 4 in length 6 legs Many feelers on lower half of body 4 hooks at back end Fan shaped gill tufts on sides Short antennae")
14
Riffle Beetle 1/4” in length Oval body covered with tiny hairs 6 legs Antennae Both larva and adult are commonly found in the water Larva Adult

15
Group Two Taxa Somewhat pollution tolerant organisms that can live in moderate quality water.

16
Crayfish 1/2” - 6” in length 8 legs 2 large claws Resemble small lobsters

17
Dragonfly Nymph 1/2” - 2” in length 6 hooked legs Large eyes Usually buried in mud or found clinging to root masses

18
Damselfly Nymph 1/2” - 1” in length 6 thin hooked legs 3 broad oar shaped tails Large eyes

19
Crane Fly Larvae 1/3” - 2” in length Plump caterpillar-like segmented body Finger-like lobes at back end Typically white in color, can be green or brown

20
Clam Clams in Ohio streams come in variety of sizes, shapes, and colors according to the species.

21
Group Three Taxa Pollution tolerant organisms that can handle poorer water quality.

22
Leech 1/4” - 2” in length Ends with suction pads

23
Aquatic Worm 1/4” - 1” in length Look like earthworms Can be very thin

24
Midge Larvae Up to 1/4” in length 2 legs on each side Worm-like segmented body Rapid squirming movement

25
Black Fly Larvae Up to 1/4” in length One end of body wider Suction pad on larger end Black head

26
Pouch Snail Shell opens on the left No operculum Breathe air

27
Habitat Where do you find macroinvertebrates? Under rocks Around tree roots Around beds of vegetation Around litter or other debris In riffle zones

28
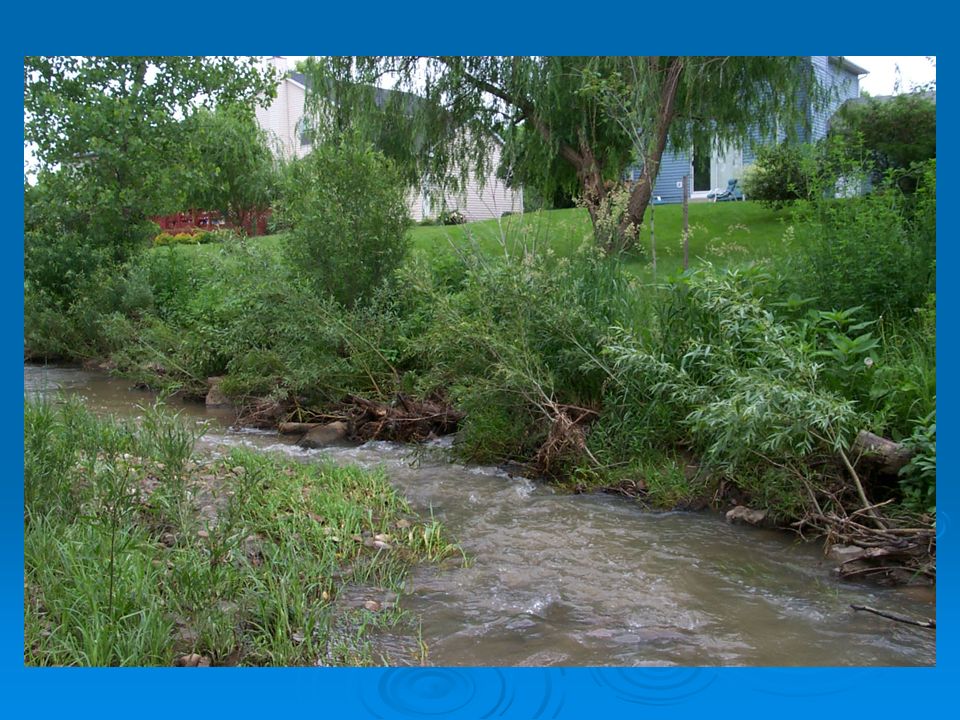
Streamside Habitat Tree overhang Roots and logs jutting into the stream Rocks and boulders along the stream edge Provide homes and shelter for animals

29
Riffle Zones Areas where water is visibly flowing over rocks and stream bottom Look like small rapids The movement over the rocks allows oxygen to enter the water

30
Abiotic Assessment

31
pH Indicates whether the stream is basic, acidic, or neutral Acidic: 0-6.9 Neutral: 7.0 Basic: 7.1-14 Most macroinvertebrates live best in a slightly basic pH (approx. 8) n What sorts of things can change the pH of a stream to dangerous levels?
 n What sorts of things can change the pH of a stream to dangerous levels .")
32
Alkalinity Indicates the stream’s ability to neutralize acids If a lot of acid is needed to cause the stream’s pH, it can neutralize well. It has high alkalinity. (Good) If the pH drops with just a little acid, the alkalinity is low. (Bad)
 If the pH drops with just a little acid, the alkalinity is low. (Bad).")
33
Dissolved Oxygen Indicates the amount of oxygen that is dissolved in the water…necessary for plants and animals! How does the water replenish its oxygen?

34
Nitrates Form of Nitrogen (NO 3 ) that is essential to life. High levels of nitrates can be toxic! Try not cleaning your fish tank for a year… Why? Nitrogen combines with Oxygen to form nitrate (NO 3 ). Too much Nitrogen removes too much oxygen and causes the fishies to suffocate. n Healthy Levels – 1 mg/L n Toxic Levels – 10 mg/L n Water treatment plant – 30 mg/L
. Too much Nitrogen removes too much oxygen and causes the fishies to suffocate. n Healthy Levels – 1 mg/L n Toxic Levels – 10 mg/L n Water treatment plant – 30 mg/L.")
35
Phosphates Essential for life Phosphorus can be dissolved or suspended Similar to Nitrates: High levels – toxic High levels – toxic Low levels – toxic Low levels – toxic Moderate levels - healthy Moderate levels - healthy

36
Stream Flow Choose a section of the creek. Use a tape measure to find the width and depth of a 100 foot area. Float a rubber ducky from one end to the other and time its flow. 100 ft. area Speed of Ducky: 100 ft. / _____sec. = _______ ft./sec. Avg. Width x Avg. Depth x ______ ft./sec. = _________ ft. 3 /sec. **Stream Flow**

37
Turbidity Clearness or cloudiness of water. The deeper you can see (clearer), the healthier the stream. Equipment: Turbidity Tube
, the healthier the stream. Equipment: Turbidity Tube.")
38
Other Stream Quality Indicators Water appearance Water odor Stream bank shape Stream bottom cover Streamside vegetation Land uses within the watershed Pipes entering the stream This is called the Qualitative Habitat Evaluation Index (QHEI)
")
40
Riparian Corridor Streamside forests Protects streambanks from erosion Protects water quality by filtering out pollutants Provides wildlife habitat

41
Stream Bank Without Vegetation Stream Bank Without Vegetation

42
Point Source Discharges Discharge entering a stream or river from a pipe or tile, i.e. Agricultural field tile Storm drains Factory outputs Water treatment plant outlets

43
Need More Information ? Check with Ohio EPA for more specific information and expertise on setting up a water quality monitoring program, especially for chemical monitoring Both ODNR and Ohio EPA can assist with Quality Habitat Environmental Index (QHEI)
.")
44
Happy Critter Hunting!

Similar presentations


Explain why upwelling occurs and what does it do when it occurs? 2)What are the two key ingredients needed for eutrophication.>")