Download presentation
Presentation is loading. Please wait.

1
Mrs. Becky Mueller Ms. Tami Folden Lincoln R-2 Schools

2
Science Fair is cross curricular. All areas are at least touched upon with Science Fair Math skills such as measuring, averaging, and collecting data English skills such as communicating effectively and reading non-fiction material Scientific Inquiry is Science Fair (GLEs) Next Generation Science Standards (NGSS)
 Next Generation Science Standards (NGSS).")
3
By: Student name(s)
")
4
Title Score Card Pts EarnedPts Possible Capital Letters where appropriate for a title 3 Independent Variable 2 Dependent Variable 2 Effect 3 Total010

7
How does changing (Independent Variable) affect (Dependent Variable)?
 affect (Dependent Variable)")
8
Testable Question Pts Earned Pts Possible Capital Letter at beginning of question 2 Question Mark at end of question 2 Question starts with "How does" 3 Question is measureable 3 Total010

11
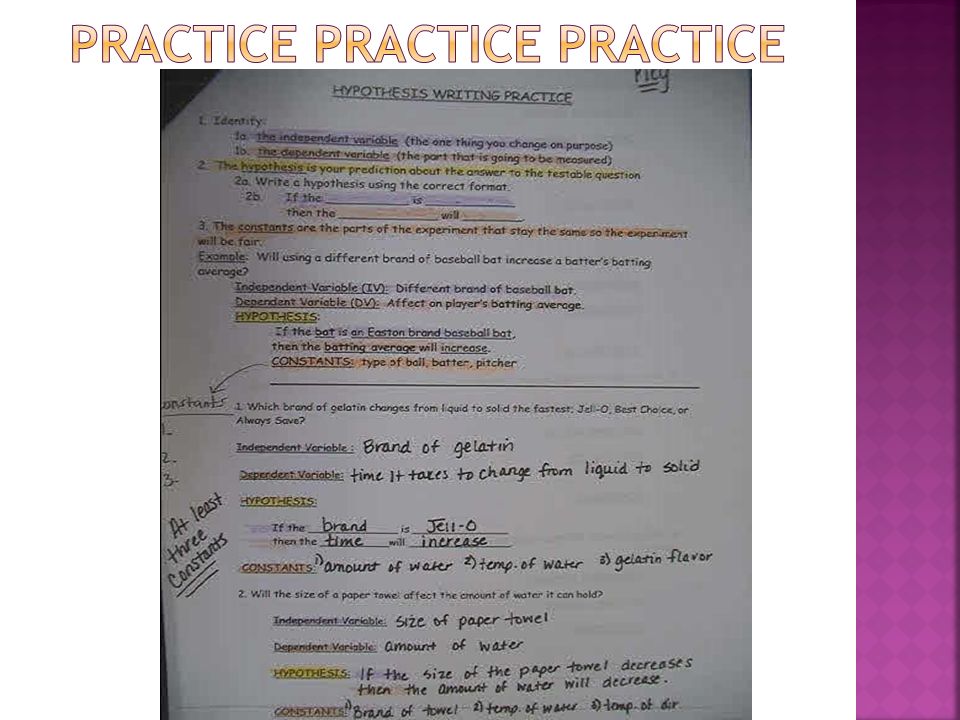
If the (independent variable) is (describe how the variable was changed), then the (dependent variable) will (describe the effect).
 is (describe how the variable was changed), then the (dependent variable) will (describe the effect).")
12
HypothesisPts EarnedPts Possible Capital Letter at beginning of hypothesis and end punctuation 3 Hypothesis is in "If…then…" format 3 IV and DV in appropriate places 4 Total010

15
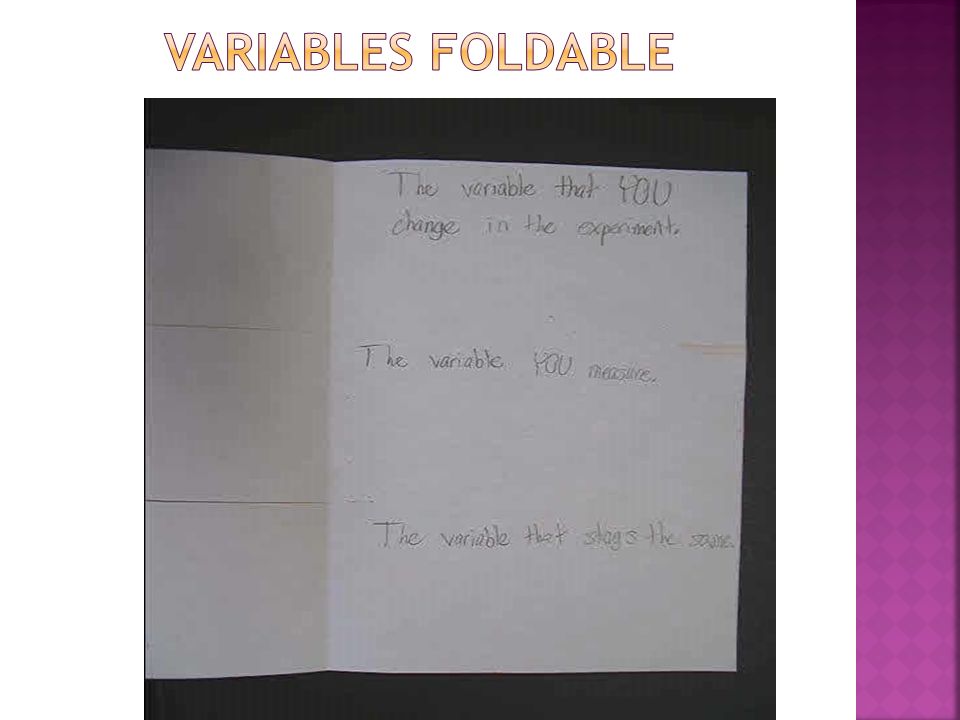
Independent Variable Dependent Variable Constant(s) ActionVariable purposely changed Measurable response to change All other factors kept the same
 ActionVariable purposely changed Measurable response to change All other factors kept the same")
16
VariablesPts EarnedPts Possible Correct Independent Variable identified 10 Correct Dependent Variable identified 10 At least 5 Constants identified 10 Total030

19
Independent Variable Trial 1Trial 2Trial 3Average

20
Data TablePts EarnedPts Possible Correct Independent Variable on left of table 3 Correct Title 1 At least 3 Trials Labeled 3 Average of Trials 1 Data in correct cells 2 Total010

21
Number of Weeks in FreezerTrial 1Trial 2Trial 3 Average Distance Stretched in Centimeters before Rubber Band Broke 011101211 18998.67 210.5 89.67 314131012.33

22
The Effect of Player on Number of Fouls and Total Points Lincoln PlayerFouls 1st quarter points 2nd quarter points 3rd quarter points 4th quarter points Total points Expected Points Roberts0020020 Kroenke, Tr1202042.78571 Kroenke, Ty3000008.35713 Sanders52203713.9286 Yearout1000002.78571 Eckhoff0002350 Kroenke, B1342092.78571 Spunaugle1222062.78571 Kranz2240065.57142

23
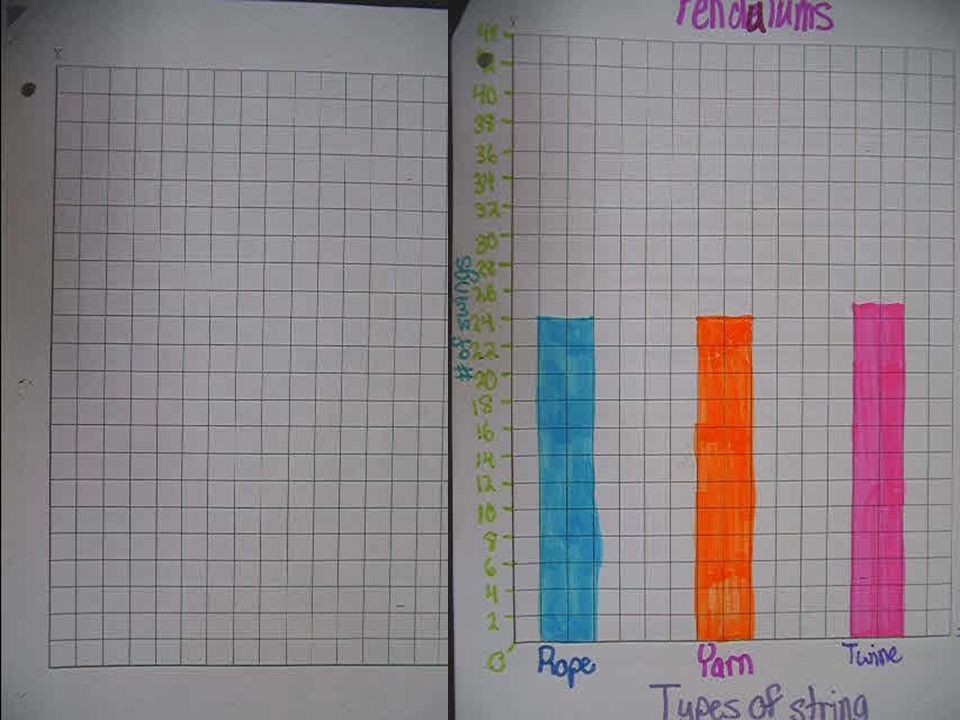
Make sure to include an appropriate title, x and y axis are both labeled with appropriate titles and scales, and plotting is correct.

24
GraphPts EarnedPts Possible Correct Independent Variable on X-axis 1 Labels for IV 1 Correct Title 1 Correct Dependent Variable on Y-axis with units 2 Numbers on Y-axis 1 Data plotted correctly 4 Total010

27
An abstract is a synopsis of the project. The abstract will be no more than 250 words. The abstract appears at the beginning of the report as well as on the display board. The abstract will have the following pieces included: Introduction Testable Question Procedures Results Conclusion Abstract

28
Pts EarnedPts Possible Intro 3 Hypothesis 5 Procedures 5 Results 5 Conclusion 3 250 words 3 No Pronouns 3 All graded material 3 Total030

29
The claim has been made that storing rubber bands in a cool place will increase the shelf life of the rubber bands. This experiment indicates there may be some truth in the statement. In a short three week experiment, rubber bands were placed in a freezer for varying amounts of time and then stretched to find out how far the rubber bands would stretch prior to breaking. The control for this experiment was zero amount of time in the freezer. The rubber bands in the freezer for three weeks stretched, on average, 1.33 cm further than the rubber bands that were never in the freezer. The rubber bands in the freezer for one week or two weeks did not stretch as far as the control rubber bands. Although further testing is needed to find the optimal amount of time to achieve the optimal amount of stretch in a rubber band, this experiment suggests storing rubber bands in the freezer will increase how far a rubber band will stretch.

30
Are fouls and total points related at the player level? The hypothesis, if a player has only 1 foul, then the player will have 7 points, was found to not have a relationship. From looking at data from a basketball game, the number of fouls is not an indicator of how many points a player will make. If the number of points was related to the number of fouls, then the points made would be evenly distributed by fouls made. Looking at the players that committed only one foul, the points made by those players is not the same and not 7 points each.

31
In your conclusion, your data will “support” or “not support” your hypothesis. It is not a “right” or “wrong” situation. You will summarize the data in this section.

32
ConclusionPts EarnedPts Possible Hypothesis is stated correctly 6 "Support" or "not supported" in statement 6 Data is summarized using averages from data table 8 No Pronouns 5 All graded material 5 Total030

33
In conclusion, the hypothesis, if the rubber bands are stored in the freezer at 0 o F for one week, then the distance stretched will be one centimeter more than all other rubber bands stored in the freezer, was not supported. The control rubber bands, on average stretched 11 cm. The rubber bands frozen for one week stretched, on average, 9.67 cm. Rubber bands frozen for two weeks stretched, on average, 9.67 cm. The rubber bands frozen for three weeks stretched, on average, 12.33 cm.

34
In conclusion, the hypothesis, if a player has only 1 foul, then the player will have 7 points, was not supported. There seems to be no consistent relationship between fouls and points scored at the individual level.

35
The procedures will be listed out in steps. Such as: 1. 2. 3.

36
ProceduresPts EarnedPts Possible Listed correctly in a numerical list 3 Sufficient instructions to conduct the experiment 4 Directions given in complete sentences 3 Total010

37
1. Determine when the rubber bands will be broken. This will take some time and has to be finished as quickly as possible once started. 2. Mark closable plastic bags with the date to put the rubber bands in the freezer. (One week from the previously determined date, two weeks from the previously determined date, and three weeks from the previously determined date.) 3. Place four rubber bands in each of the four bags and close the bag. 4. On the appropriate date, place the bag with the four rubber bands in the freezer. 5. Prior to taking the rubber bands out of the freezer, a stretching board needs to be built. Use a 1” x 4” approximately 21 cm long. Drive two finish nails in the board 1.5 cm from the end and 1.5 cm from either edge.
 3. Place four rubber bands in each of the four bags and close the bag. 4. On the appropriate date, place the bag with the four rubber bands in the freezer. 5. Prior to taking the rubber bands out of the freezer, a stretching board needs to be built. Use a 1 x 4 approximately 21 cm long. Drive two finish nails in the board 1.5 cm from the end and 1.5 cm from either edge..")
38
6. On a piece of paper wider than the gap between the two nails, secure a metric tape measure with masking tape with the zero end at the very edge of the paper. 7. Secure the paper to the board against the two nails with masking tape with the measuring tape in the middle. 8. Place one rubber band on the two nails. 9. Pull both sides of the rubber band along the tape measure with the wire hook until the rubber band breaks. 10.Record the measurement of how far the rubber band was pulled before breaking in the data table. 11. Break at least three of the rubber bands and record all data.

39
1. Collect data including player fouls and player points from a basketball game. 2. Graph the fouls and points for each player. 3. Pay attention to the graphed data to determine if there is any consistent trends in the data (i.e. if the fouls stay low the points increase for a player).
..")
40
List all the materials needed to do this investigation / experiment by using bullets. Include amounts of each material needed.

41
Materials ListPts Earned Pts Possible Listed in a bulleted list 4 Sufficient amounts of materials listed to conduct the experiment 6 Total010

42
16 matching rubber bands Freezer space Closable plastic bags (Ziploc snack bags work well) 1” x 4” by 21 cm board 2 eight penny finish nails Hammer Metric measuring tape Masking tape Paper 10 x 20 cm Sturdy wire hook
 1 x 4 by 21 cm board 2 eight penny finish nails Hammer Metric measuring tape Masking tape Paper 10 x 20 cm Sturdy wire hook")
43
Data from Official Score Book from a basketball game Graph paper and pencil or Excel Program on a computer

44
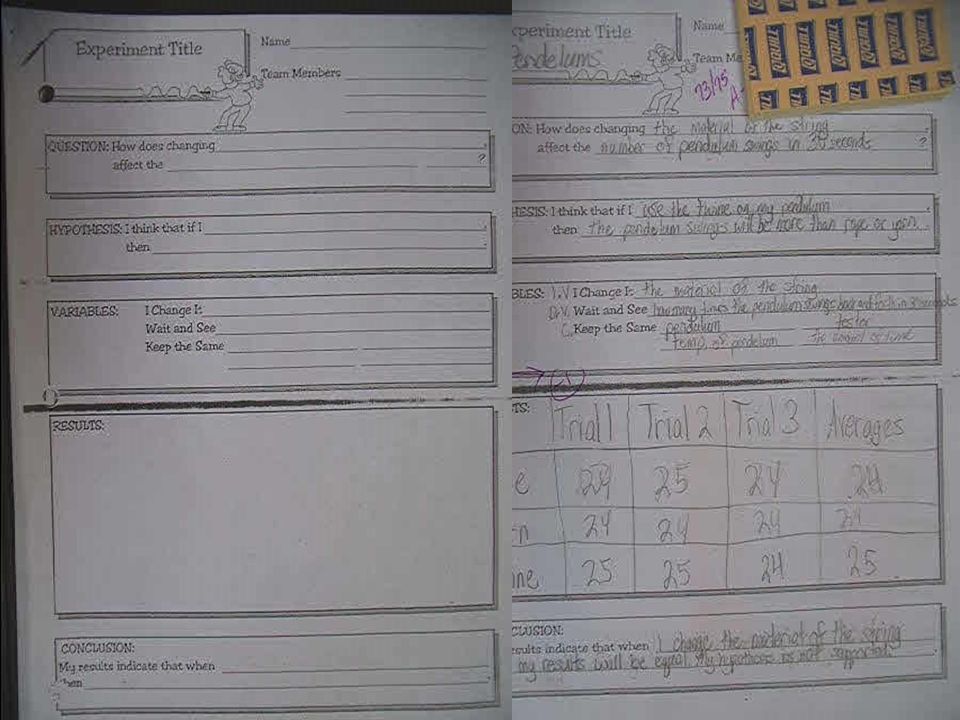
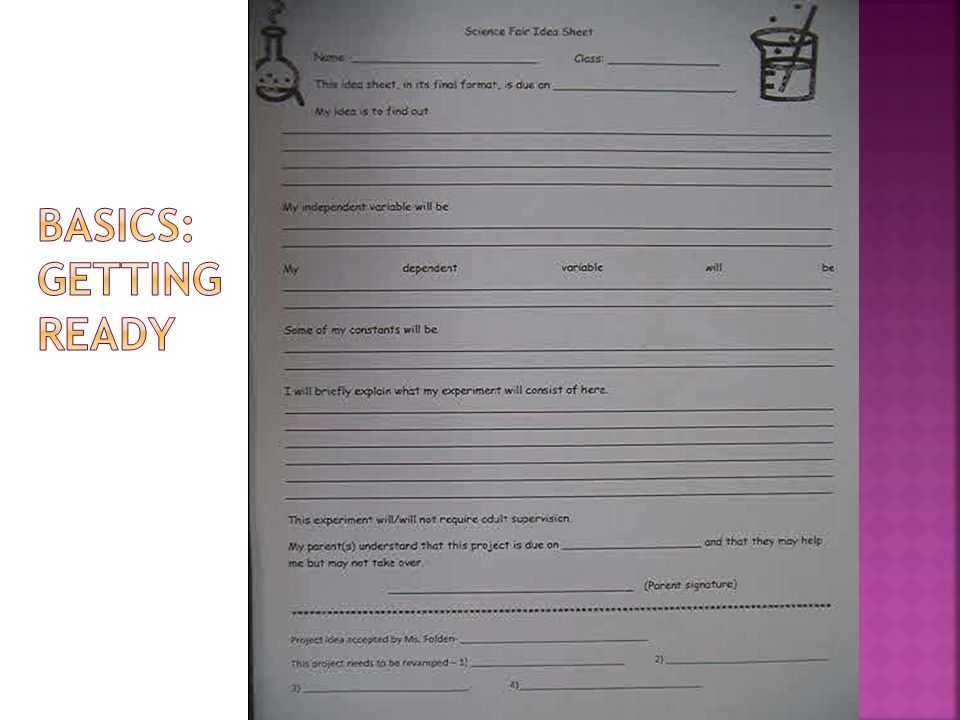
Students need some background knowledge before jumping into experiments. Variables What they are How to write them Hypothesis What it is How to write one

45
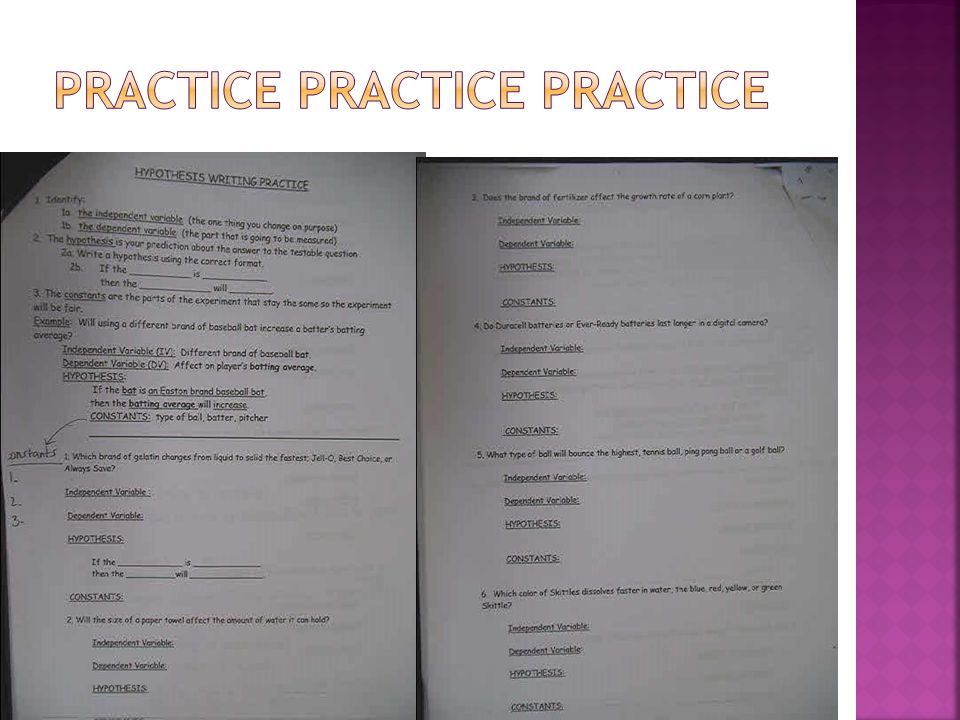
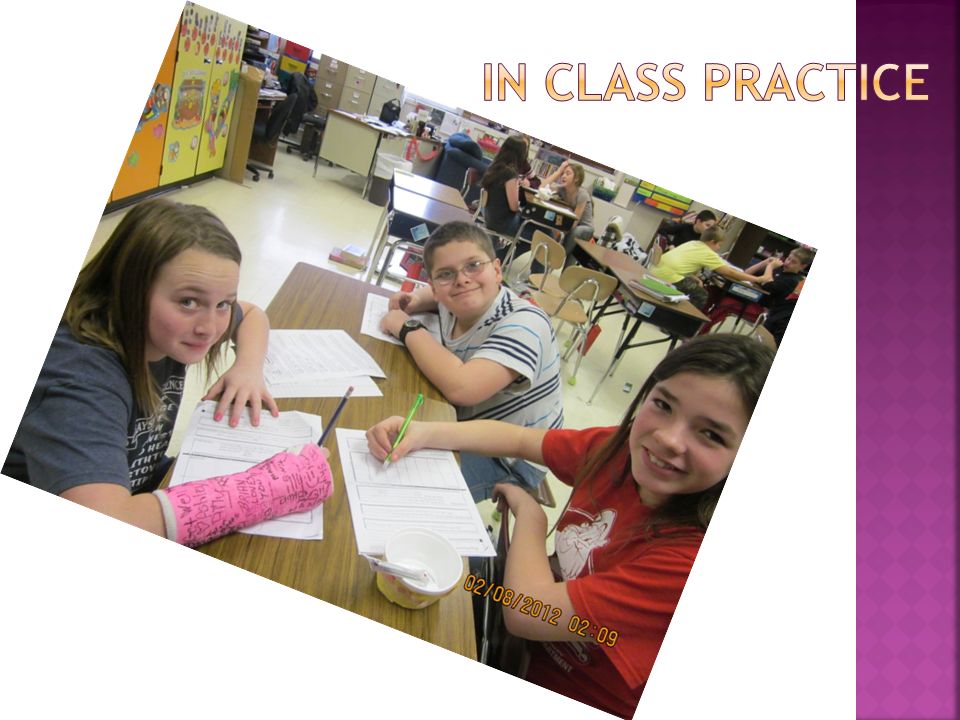
Students have a really hard time remembering which variable is which Color coding seems to help a whole lot. Foldables to refer back to help. Lots and lots of practice.

60
Students need a lot of time to take what they have learned and put it to use. Do more than one experiment in the classroom. Use groups to help the students learn from each other.

67
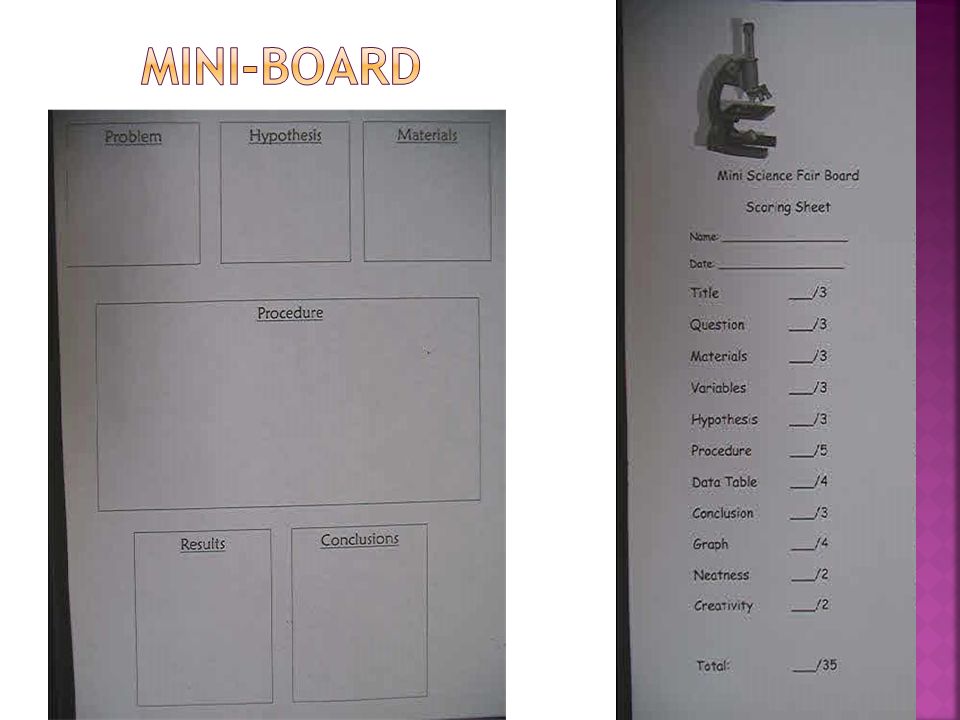
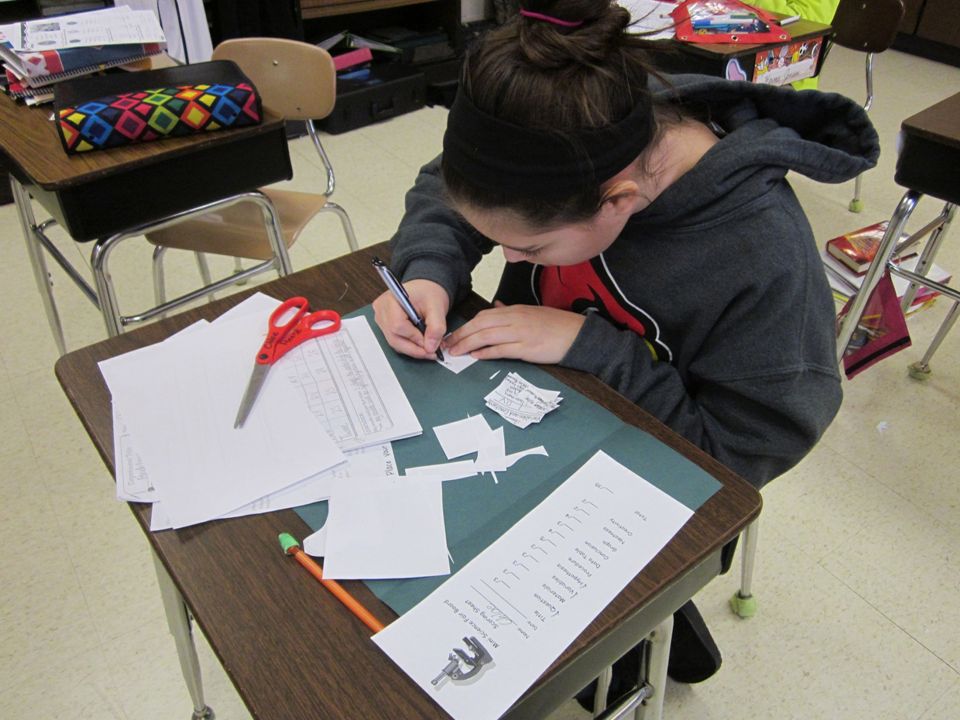
In order to practice putting together a science fair board, have them make a mini-board using large construction paper.

73
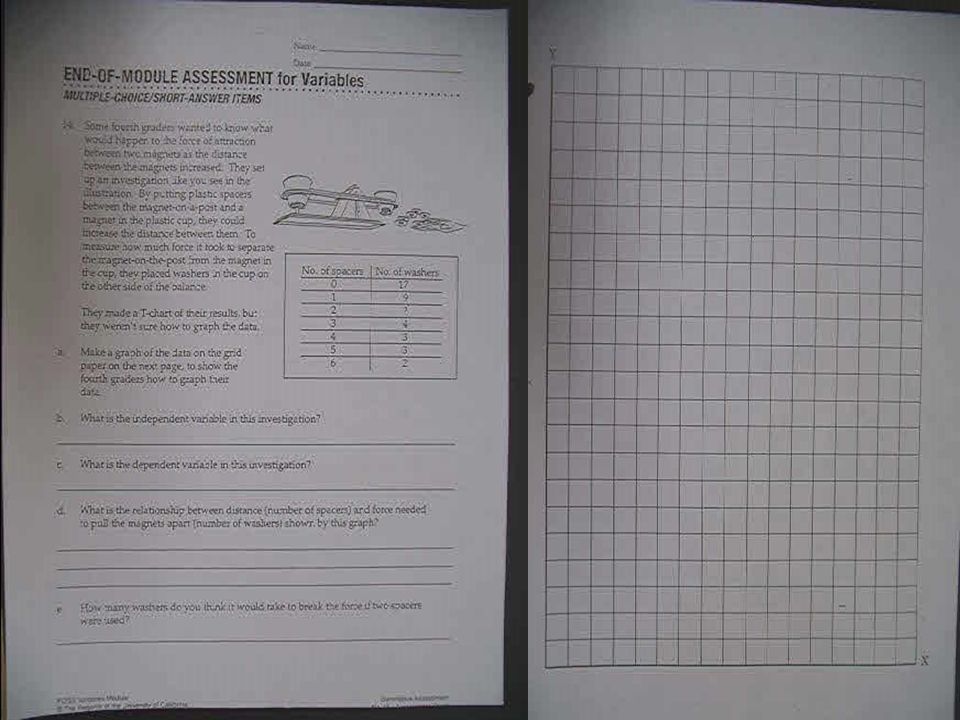
Some teachers may like to assess in a written form whether the students have really retained what they have learned. Why is this important? If the students have not learned the basics, they cannot put it to use in a science fair project.

76
Talk to your building principal about securing a date. (6-8 weeks time frame) Send a letter home to parents. Secure judges (if you wish). Pass out scoring guides to students. Make up reminder slips to send home every two weeks. Help students come up with an idea. Order ribbons (or make your own certificates)
 Send a letter home to parents. Secure judges (if you wish). Pass out scoring guides to students. Make up reminder slips to send home every two weeks. Help students come up with an idea. Order ribbons (or make your own certificates).")
84
A group of four people String Washer Paper clip Experiment sheet Graph Ruler Timer

Similar presentations


>")

![Keeping A Scientific Journal I. Outline of each science project or journal entry (400 points) A. Write a Topic/Title at the top of the page (10) [Page1]](/13/3902399/big_thumb.jpg "Keeping A Scientific Journal I. Outline of each science project or journal entry (400 points) A. Write a Topic/Title at the top of the page (10) [Page1]>")


 Turn in WB 8—”Force Practice” IN: ON NOTE CARD (name on back): copy and answer (use GUESS): copy and answer (use GUESS):>")


