Download presentation
Presentation is loading. Please wait.

1
Why is Global Population Increasing? Chapter 2 Key Issue 2

2
Key Issue 2- Where has the worlds population increased? Geographers can measure this 3 ways –Crude Birth Rate- total birth rate compared to 1000, so 20 would mean 20 births per year for every 1000 –Crude Death Rate- Deaths every year per 1000, What happens when the death rate is faster then the birth rate? How about the opposite? –Natural Increase Rate- CBR-CDR

3
Crude Birth Rate Total birth rate compared to 1000, so 20 would mean 20 births per year for every 1000

4
Crude Death Rates Fig. 2-9: The Total fertility rate (TFR) is the number of children an average woman in a society will have through her childbearing years. The lowest rates are in Europe, and the highest are in Africa and parts of the Middle East. Deaths every year per 1000, What happens when the death rate is faster then the birth rate? How about the opposite?
 is the number of children an average woman in a society will have through her childbearing years. The lowest rates are in Europe, and the highest are in Africa and parts of the Middle East. Deaths every year per 1000, What happens when the death rate is faster then the birth rate. How about the opposite .")
5
Natural Increase Rates Fig. 2-7: The natural increase rate (NIR) is the percentage growth or decline in the population of a country per year (not including net migration). Countries in Africa and Southwest Asia have the highest current rates, while Russia and some European countries have negative rates.
 is the percentage growth or decline in the population of a country per year (not including net migration). Countries in Africa and Southwest Asia have the highest current rates, while Russia and some European countries have negative rates..")
6
Natural Increase Rate NIR 1.2 % per year –Most of the world’s additional people live in countries that are least able to maintain them. Doubling Time –the % of time it takes to double the population in the 60s- 35 years 2000- 51 years what does this tell us? Virtually 100% of the Natural Increase is located in the LDC, WHY?

7
World Population Growth 1950 - 2005 Fig. 2-6: Total world population increased from 2.5 to over 6 billion in slightly over 50 years. The natural increase rate peaked in the early 1960s and has declined since, but the number of people added each year did not peak until 1990.

8
Total Fertility Rates

9
Total Fertility Rate –Fertility – this is ~2.7 for the world today, but varies greatly by region with many sub-Saharan countries exceeding 6 compared to less than 2 in nearly every European country. –The average amount children a women will have throughout her life For the world its around 3, In Africa its above 6- in the U.S. lower then 1

10
Fig. 2-10: The infant mortality rate is the number of infant deaths per 1000 live births per year. The highest infant mortality rates are found in some of the poorest countries of Africa and Asia. Infant Mortality Rates

11
Fig. 2-11: Life expectancy at birth is the average number of years a newborn infant can expect to live. The highest life expectancies are generally in the wealthiest countries, and the lowest in the poorest countries. Life Expectancy at birth

12
Tool Box for Population http://www.youtube.com/watch?v=dD- yN2G5BY0&feature=relatedhttp://www.youtube.com/watch?v=dD- yN2G5BY0&feature=related Crude Birth Rate- love birth rate compared to 1000, so 20 would mean 20 births per year for every 1000 Crude Death Rate- Deaths every year per 1000, What happens when the death rate is faster then the birth rate? How about the opposite? Natural Increase Rate- CBR-CDR –Doubling Time- the % of time it takes to double the population, in the 60s- 35 years 2000- 51 years what does this tell us? –Virtually 100% of the Natural Increase is located in the LDC, WHY? Total Fertility Rate Fecundity- Ability of women to conceive- Higher in larger women –General Fertility Rate- GFR- number of births in her fecund years –Fertility – this is ~3.0 for the world today, but varies greatly by region with many sub-Saharan countries exceeding 6 compared to less than 2 in nearly every European country. –The average amount children a women will have throughout her life For the world its around 3, In Africa its above 6- in the U.S. lower then 1 Infant Mortality Rate- deaths of infants within one year, per 1000 people Mortality – is related to infant mortality (the annual number of deaths of infants under 1 year of age compared with total live births) and life expectancy (at birth measures the average number of years a newborn can expect to live)
 and life expectancy (at birth measures the average number of years a newborn can expect to live).")
14
–In LDC’s 10%, In MDC’s considerable different U.S. has a high rate compared to Europe and Canada- Minorities in the states have double the likelihood compared to Latin America and Asia –This is attributed that there is a large portion of Minorities that cannot afford good health care, Do you think the new health care bill will help this? Life expectancy- the average life of an infant- 70’s in W. Europe, 40s in Sub-Sahara Africa What happens when the LDC are living longer then the MDC

15
Mortality –Mortality – is related to infant mortality (the annual number of deaths of infants under 1 year of age compared with total live births) and life expectancy (at birth measures the average number of years a newborn can expect to live) –Infant Mortality Rate- deaths of infants within one year, per 1000 people –In LDC’s 10%, In MDC’s considerable different U.S. has a high rate compared to Europe and Canada- Minorities in the states have double the likelihood compared to Latin America and Asia –This is attributed that there is a large portion of Minorities that cannot afford good health care, Do you think the new health care bill will help this? Life expectancy- the average life of an infant- 70’s in W. Europe, 40s in Sub-Sahara Africa What happens when the LDC are living longer then the MDC

16
Changes in Fertility Rates

17
Replacement and Mortality Replacement level fertility- replace the pop –Zero-Pop- Growth- =0 Rate of natural increase- CBR-CDR/10 –Roughly 1.2%- Around 50 years –Doubling Time- the % of time it takes to double the population, in the 60s- 35 years 2000- 51 years what does this tell us? –Doubling rate and the rule of 70 –Can differ in Pronatalist Populations

18
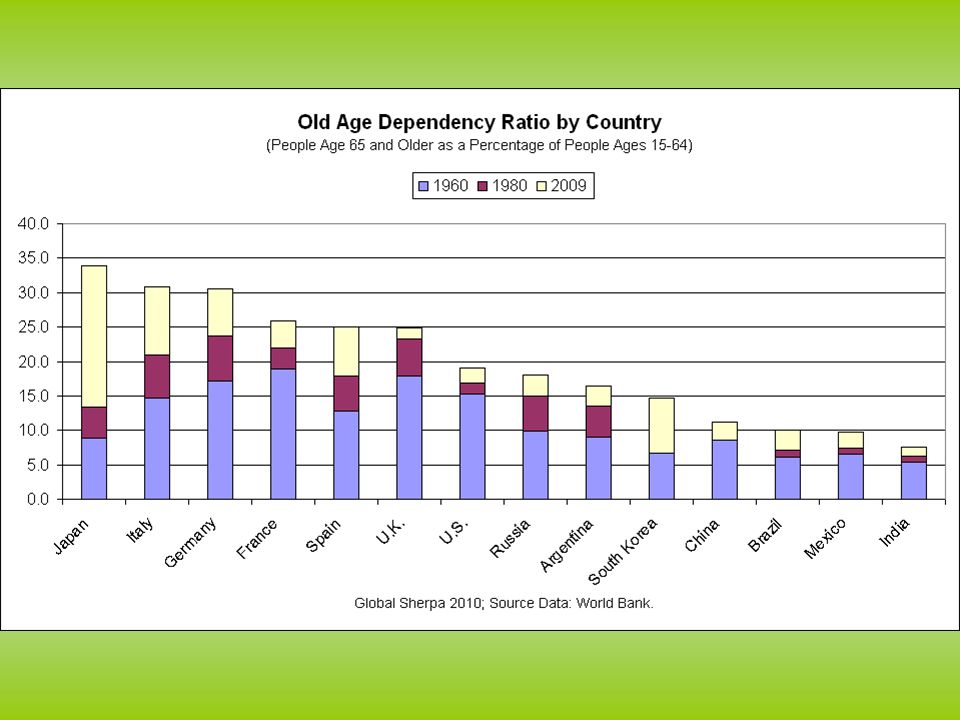
Dependency Ratio # of people too old (65 years & up) or too young (0-14 years) to work compared to the # of productive workers
 or too young (0-14 years) to work compared to the # of productive workers")
20
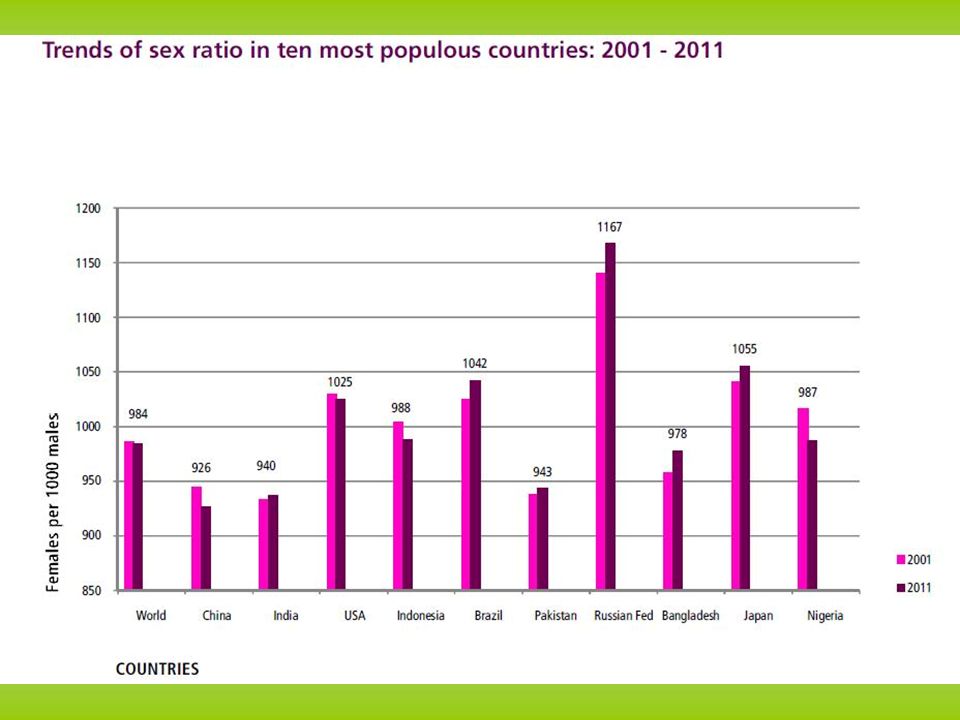
Sex Ratio # of males per 100 females in the population

22
POPULATION STRUCTURE The population pyramid displays the age and sex structure of a country or given area Usually, but not always, in % to make for easier comparisons between countries FEMALES To the right MALES To the left Population in Five Year Age bands OLD DEPENDANTS ECONOMICALLY ACTIVE YOUNG DEPENDANTS

23
What Population Pyramids Show Us KEY slope of pyramid indicate the death rate width of the base is related to birth rate/fertility rate proportions of men and women can suggest male or female migrations height of graph can indicate life expectancy (ignore the very thin end of the wedge as occurs on graph B as these people are a definite minority) "kinks" indicate dramatic reductions in birth rate or increases in death rate in the past area of graph indicates total population - compare areas of different population age groups or different sex on one graph The overall shape of the population pyramid can indicate whether it is an Economically More Developed Country or Economically Less Developed Country Economically More Developed Country Economically Less Developed Country
 kinks indicate dramatic reductions in birth rate or increases in death rate in the past area of graph indicates total population - compare areas of different population age groups or different sex on one graph The overall shape of the population pyramid can indicate whether it is an Economically More Developed Country or Economically Less Developed Country Economically More Developed Country Economically Less Developed Country")
24
Population Pyramids related to the Demographic Transition Model Stage 1 Stage 2Stage 3Stage 4 Both birth rates and Death rates are High, so population growth rates are slow but population Is usually restored Due to high birth Rate. Short life Expectancy EXAMPLES: none today - Afghanistan, Ivory Coast (30 years ago)There are no Stage 1 countries today Population starts to grow at an exponential rate due to fall in Crude Death Rate. More living In middle age. Life expectancy rises Infant mortality rate falls. EXAMPLES: DR Congo, Yemen, Afghanistan (today) Population continues to grow but at slower rate. Low C Death Rate. Dramatically declining Crude Birth Rate. EXAMPLES: India, Brazil (late 3) – Most of world is in 3 IMPLICATIONS Low Crude Birth Rate and Crude Death Rate Higher dependency ratio and longer life expectancy Crude Death Rate does Rise slightly because of The ageing population EXAMPLES: China, United States, Canada, Australia There is some merit in including or considering a Stage 5 today with a declining population- Europe - Japan
There are no Stage 1 countries today Population starts to grow at an exponential rate due to fall in Crude Death Rate. More living In middle age. Life expectancy rises Infant mortality rate falls. EXAMPLES: DR Congo, Yemen, Afghanistan (today) Population continues to grow but at slower rate. Low C Death Rate. Dramatically declining Crude Birth Rate. EXAMPLES: India, Brazil (late 3) – Most of world is in 3 IMPLICATIONS Low Crude Birth Rate and Crude Death Rate Higher dependency ratio and longer life expectancy Crude Death Rate does Rise slightly because of The ageing population EXAMPLES: China, United States, Canada, Australia There is some merit in including or considering a Stage 5 today with a declining population- Europe - Japan.")
25
Practice with real pyramids-What Stage of DTM? 3 2 4 5

26
Practice with real pyramids-What Stage of DTM is US? Challenging – why? 2011 Data TFR 2.1 BR 14 DR 8 Natural Increase:.6% Growth Rate:.9% Why is Growth Rate higher? How does this impact pyramid? Pyramid looks like a late 3 country. But does US fit description profile of Stage 4 better?

27
Fig. 2-12: The crude death rate (CDR) is the total number of deaths in a country per 1000 population per year. Because wealthy countries are in a late stage of the Demographic Transition, they often have a higher CDR than poorer countries. Percent of Population Under Age 15
 is the total number of deaths in a country per 1000 population per year. Because wealthy countries are in a late stage of the Demographic Transition, they often have a higher CDR than poorer countries. Percent of Population Under Age 15.")
Similar presentations


 Total Fertility Rate (TFR) Crude Death Rate (CDR) Infant Mortality.>")


