Download presentation
Presentation is loading. Please wait.

1
“3-D” & Temporal GIS

2
Horizontal sure, but …. how to deal with elevation/depth or time Vertical Horizontal and vertical Horizontal, vertical, and time

3
ArcScene 9 Demo http://dusk.geo.orst.edu/gis/captivate_arcscene/arcscene_demo.htm

4
The Vertical Dimension two very different ways of looking at representations of the vertical dimension (third dimension) in GIS “2.5-D” and “3-D” vertical dimension combined with temporal query = “4-D”
 in GIS 2.5-D and 3-D vertical dimension combined with temporal query = 4-D")
5
“2.5 D” most common way of “doing 3D” in commercial GIS packages z value (normally elevation) is recorded as an attribute for each data point (x,y) z values can be used in a perspective plot to create the appearance of 3 dimensions not true 3-D representation because elevation is not encoded in data structure, not in topology
 is recorded as an attribute for each data point (x,y) z values can be used in a perspective plot to create the appearance of 3 dimensions not true 3-D representation because elevation is not encoded in data structure, not in topology")
6
2.5 D Representations attractive displays of topography and other continuous surfaces from DEMs or TINs perspective plots computed from any viewpoint additional layers "draped" over the surface

7
“Coastal Terrain Model” USGS Topography + = Integrated Topo-Bathy Model Bathymetry Topography …a surface that integrates topography and bathymetry

8
Satellite Imagery Draped on Topo-bathy model

9
Boundary Representation TIN is a 2.5 D type of B-rep one value of z for every x,y each object has faces, edges, points

10
Perspective Plot from TIN (2.5-D B-Rep)
")
11
B-Rep of a Cave Passage

12
True 3-D store data in structures that actually reference locations in 3D space (x,y,z) here z is not an attribute but an element of the location of the point if z is missing, object does not exist! several z’s possible for a single x-y pair, soundings in the ocean or atmosphere, geologic logs of wells

13
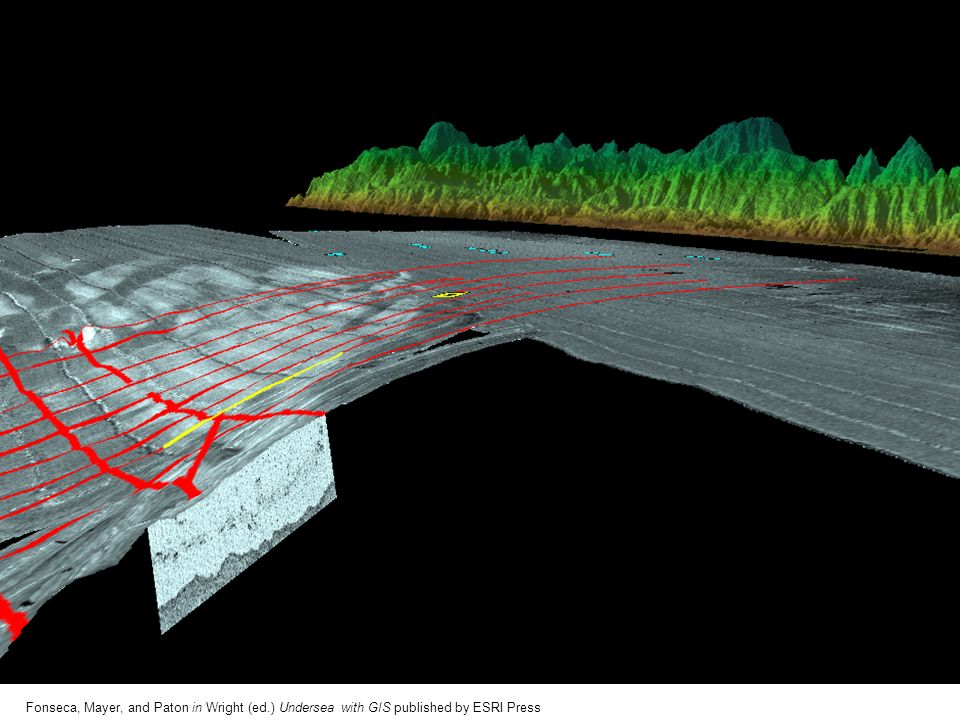
3-D Applications geological/geophysical exploration engineering design of mines, quarries, dams, reservoirs, etc. scientific explanation of 3D processes such as ocean currents or lava flows “data driven” - may not necessarily know what you will find in 3D so the structure of the representation may enhance types of analyses that can be performed

14
Fonseca, Mayer, and Paton in Wright (ed.) Undersea with GIS published by ESRI Press
 Undersea with GIS published by ESRI Press")
16
“Fledermaus” Interactive Visualization Systems www.ivs3d.com http://dusk.geo.orst.edu/gis/captivate_ivs/ivs1.htm http://dusk.geo.orst.edu/gis/captivate_ivs/ivs2.htm http://dusk.geo.orst.edu/gis/captivate_ivs/ivs3.htm

17
Volumes visualization of volumes modeling of volumes algorithms for 3D spatial analysis simpler, more efficient, if data in a volumetric form

18
Example two: Hydrothermal Plume model output VTK/Java3D allows volume calculations, rendering, and analysis. ● 3D probe ● animation ● bathymetry ● multibeam ● Smith/Sandwell Vance et al., NOAA Alaska Fisheries Science Center

19
Underwater Behavior of Humpback Whales: Potential Entanglement in Fishing Gear Stellwagen Bank National Marine Sanctuary - Ware et al., Center for Coastal and Ocean Mapping, U. of New Hampshire

20
Spatial Occupancy Enumeration (SOE) volume is divided into cubes or voxels usually produced by converting from B- reps (similar to converting vectors to rasters in 2D) mass, volume and surface area are quickly computed as Boolean operations [on (full) / off (empty)] or voxel counts
![Spatial Occupancy Enumeration (SOE) volume is divided into cubes or voxels usually produced by converting from B- reps (similar to converting vectors to rasters in 2D) mass, volume and surface area are quickly computed as Boolean operations [on (full) / off (empty)] or voxel counts](http://images.slideplayer.com/33/8223013/slides/slide_20.jpg "Spatial Occupancy Enumeration (SOE) volume is divided into cubes or voxels usually produced by converting from B- reps (similar to converting vectors to rasters in 2D) mass, volume and surface area are quickly computed as Boolean operations [on (full) / off (empty)] or voxel counts")
21
SOE of a Mine/Quarry Surface Water Runoff Gold, Transactions in GIS, 2006

22
Commercially Available? Research frontier not too many truly 3D GIS packages on the market 2- or 2.5D GIS linked to 3D modeling package

23
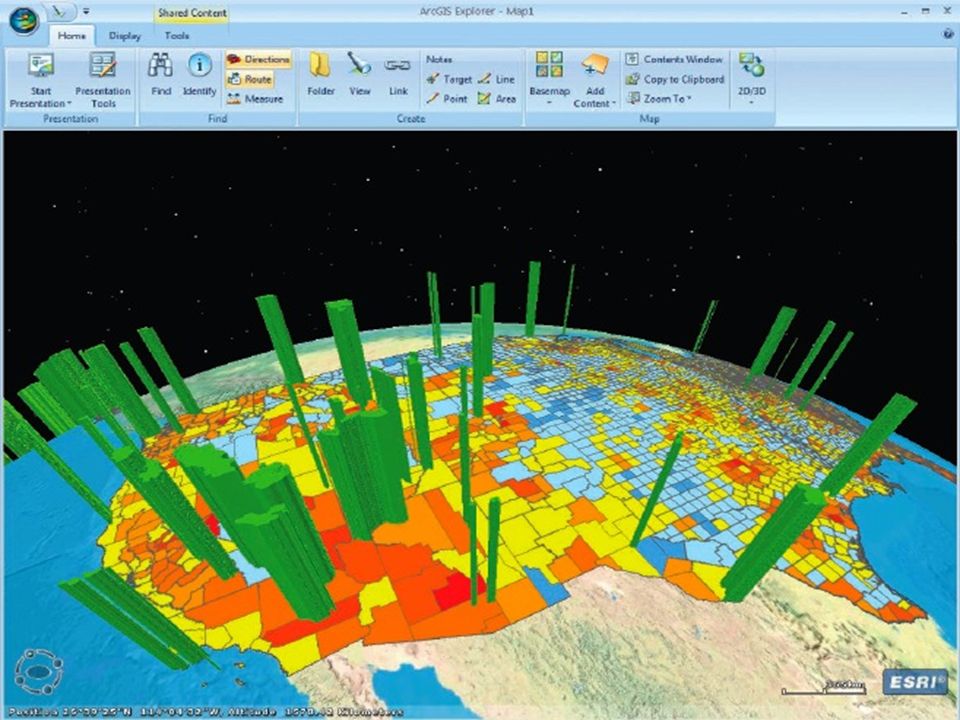
You knew I had to mention it… GOOGLE EARTH

27
Sketch Ups and Touch Tables Insert your own objects Google Ocean “Visualize” with your hands http://www.youtube.com/watch?v=X2pPe W4cUgU&feature=PlayList&p=FB02B6AD3 5983A48&playnext=1&index=14 http://www.youtube.com/watch?v=W3dz2 xpCJVU&feature=related

28
Time Dependence time dependence adds a third dimension to spatial data, just as the vertical dimension does or may be added to 3 spatial dimensions to give 4D

29
Coastal Evolution of OR/WA Cross & Twichell, USGS Woods Hole in Wright (ed.) Undersea with GIS, ESRI Press, 2002.
 Undersea with GIS, ESRI Press, 2002.")
30
Time and Geographical Data computer science has dealt with time dependence of records in databases e.g., records may be valid only for limited times geographical cases are more complex - objects may have limited existence, but may also move, change shape, and change attributes database models for time? few “temporal GISs” on the market Tracking Analyst for ArcGIS

31
Dealing with Time in GIS shape of objects same, but attributes change same shape, same attributes, but boundaries between objects or locations of objects change Turn on/off or move shapes of objects change through time define a limited number of time "slices"

Similar presentations


 John Wiley and Sons Ltd 9. Geographic Data Modeling.>")


>")


