Download presentation
Presentation is loading. Please wait.

1
Department of Research and Planning November 14, 2011

2
Performance Assessment Measures

3
Each year public schools earn accountability ratings for: State Accreditation NCLB-Adequate Yearly Progress (AYP)
")
4
Standards of Accreditation Student performance in one year provides the basis for a school’s state accreditation rating the following year. All tests within a content area are combined to create a pass rate for each of four core content areas—language arts, math, social studies, science. A three year calculation will be used if needed.

5
Accreditation calculation example Pass rates are not an average, but are based upon a sum of those who passed the tests divided by the sum of those who took the tests. English Grade 3 Reading Grade 4 Reading Grade 5 Reading Grade 5 Writing English Subtotal Remed. Recov. English Sub-Total w/RRVGLAVAAP English Total Pass Rate Percent Passing 201167.09%73.08%91.49%75.00% 77.23% 100.00%77.93% 100.00%78.59% # Passing5357867226811279 11 290 # Taking the Test7978949634711358 11 369

6
AYP Performance Framework Multiple targets must be met for divisions and schools to make AYP. Targets are based upon Reading (required performance measure) Math (required performance measure) Other academic indicator (selected by the elementary and middle school) ○ Writing, history, science, attendance Other academic indicator (required for high schools) ○ Graduation rate Participation in the assessment program
 Math (required performance measure) Other academic indicator (selected by the elementary and middle school) ○ Writing, history, science, attendance Other academic indicator (required for high schools) ○ Graduation rate Participation in the assessment program.")
7
AYP Targets Test Year Reading % Prof. Math % Prof. Other Ind.Part.Attend.Grad. Rate 2010-11868570959480 2011-12919070959480 2012-13969570959480 2013-14100 70959480

8
AYP Performance Framework Schools and seven groups must meet performance and participation AYP targets in reading and math. The school as a whole must meet the target for the other academic indicator. If there are less than 50 in a group, the participation and performance requirements do not apply.

9
AYP Performance Framework NCLB – Safe Harbor If schools or groups do not meet performance targets and do meet participation targets, safe harbor calculations can be used. If schools or groups do not meet performance targets and do meet participation targets, safe harbor calculations can be used. Safe harbor applies to the group that does not meet the minimum performance target but has a 10% or greater reduction in the failure rate. When applied, Safe Harbor considers the values for the “other academic indicator” for that group. Safe harbor applies to the group that does not meet the minimum performance target but has a 10% or greater reduction in the failure rate. When applied, Safe Harbor considers the values for the “other academic indicator” for that group. Schools using writing, history or science must achieve a 70% pass rate for the group in question. Schools using writing, history or science must achieve a 70% pass rate for the group in question. Schools using attendance must have at least a 94% attendance rate for the group in question. Schools using attendance must have at least a 94% attendance rate for the group in question. High Schools must show an increase in graduation rate for the group in question. High Schools must show an increase in graduation rate for the group in question.

10
AYP Participation Example

11
AYP Performance Example SAFE HARBOR

12
AYP Performance Example

13
Analyzing SOL Data School Level Data Grade Level Data Teacher Data Student Data

14
Reporting Category Scores The scaled score for a reporting category uses a different scale from the one used to report the total test score. Ranges from 0 – 50. Reporting category data is provided to schools in the 34 report. Both test and teacher information is provided.

15
34 Report The 34 Report must be used in conjunction with the SOL Blueprints! 23%77%

16
SPBQ Report The Student Performance by Question Report is available for each test and student. Use these reports to identify SOL strands where: At least 70% or fewer students responded correctly, or The school’s performance is 10 percentage points below the division.

17
SPBQ Report

18
SOL Data Analysis Activity

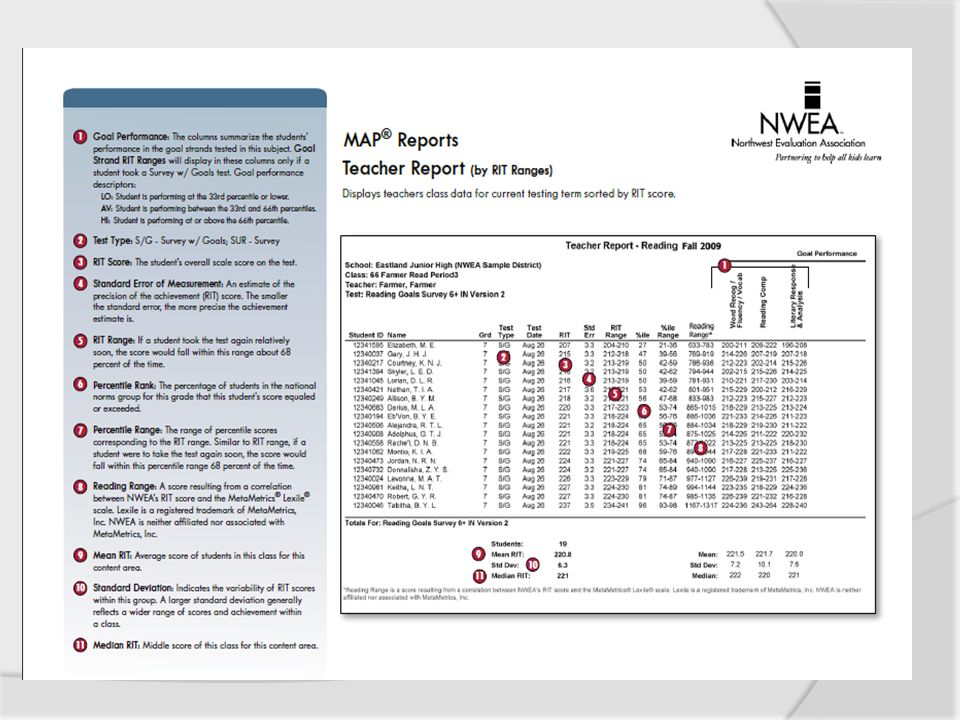
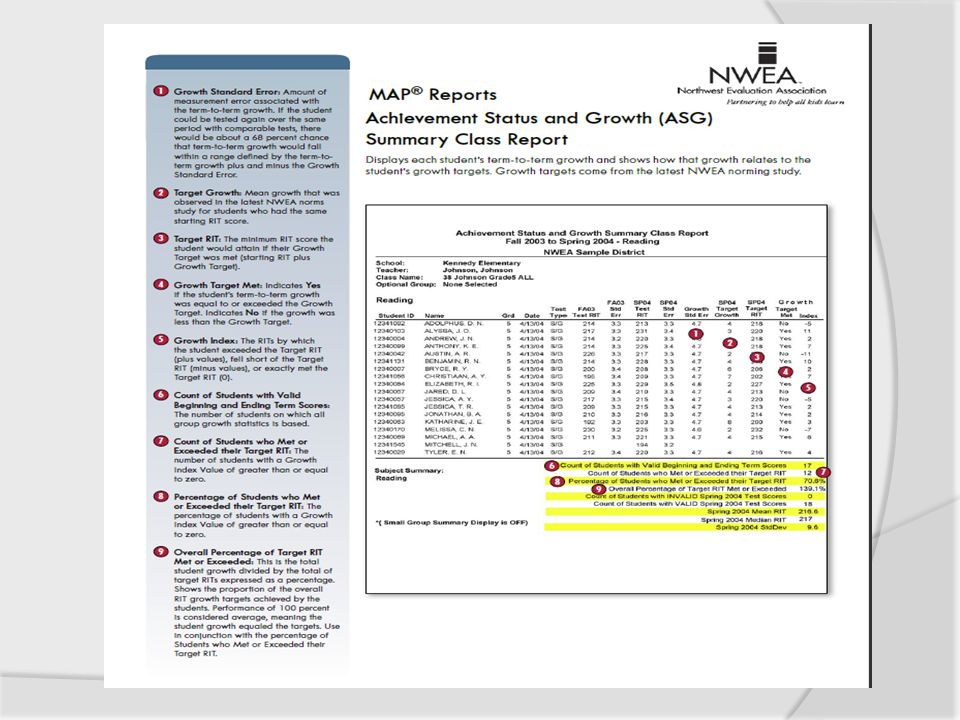
19
Teacher Report Achievement Status and Growth (ASG) Summary
 Summary")
21
2011 Normative Data Reference Status Norms of RIT Scores

22
Cut Scores for Remediation -Reading

23
Cut Scores for Remediation - Math

25
1. Draw a star beside all RIT scores that are within 3 points of the grade-level mean. (Mean = 207, 204- 210) On grade level 2. Go to percentile (%ile) column, draw a line at the 96 th percentile. Gifted and talented 3. Draw a line at the RTI cut scores to identify remediation students (<193) 4. In the summary data, highlight the highest standard deviation. Largest academic diversity 5. Draw a box around the highest and lowest median RIT. Area of strength, area of weakness
 On grade level 2. Go to percentile (%ile) column, draw a line at the 96 th percentile. Gifted and talented 3. Draw a line at the RTI cut scores to identify remediation students (<193) 4. In the summary data, highlight the highest standard deviation. Largest academic diversity 5. Draw a box around the highest and lowest median RIT. Area of strength, area of weakness.")
28
FALL ASG REPORT 1. What are some possible reasons that the projections are different for the students? 2. How might you begin to talk with your students about the differences? 3. What impact might this have on the teachers? 4. How can teachers help parents understand the concept of academic growth? Spring ASG REPORT 1. Which students exceeded the growth projection by the highest value? 2. Which student was the furthest from meeting his/her growth projection? 3. Did any student exactly meet their growth projection? 4. What is the percentage of students who met or exceeded their Target RIT? 5. How might you use this report?

Similar presentations


 Needs Assessment (Why ) Improvement Plan (How) Implement and Monitor.>")


 Michigan Department of Education Office of Psychometrics, Accountability, Research, & Evaluation Summer.>")


 – Initial Designation.>")