Download presentation
Presentation is loading. Please wait.

1
Understanding Accountability Reports

2
Where Do I Find These Reports? Counselor Principal School Improvement Specialist System Testing Coordinator State Department Website

3
A R M T A labama R eading M athematics T est

5
Grade Level School Code Name of Stem Test Date School Name

6
Number Tested: Total students tested Mean Scaled Scores Mean Scaled Scores: The reading and mathematics test are scaled. The mean scaled score tells you where an individual or group fall on that scale. The scaled score can be used to monitor progress from year to year.

7
Achievement Levels: Standards have been set in order to report the groups overall performance in reading and math by an achievement level. There are 4 achievement levels: Level I – Does not meet academic content standards Level II – Partially meets academic content standards Level III – Meets academic content standards Level IV- Exceeds academic content standards The number and percent of students per achievement level is displayed.

8
Points Possible: Indicates how many total points are possible for that content standard and how many points are possible by item type (multiple-choice, gridded, or open-ended).
.")
9
Points Earned : Indicate how many points of the total possible are earned for each content standard and by item type (multiple- choice, gridded, or open-ended).
.")
10
Mean Percent Correct Indicates the average percent correct for the group on each content standard.

11
A H S G E A labama H igh S chool G raduation E xam

13
System Name School Code Test Date Exam Title Test Edition Name of Sub-test Report Type School Name

14
Total students that completed this sub-test Total students per grade level that completed this subtest

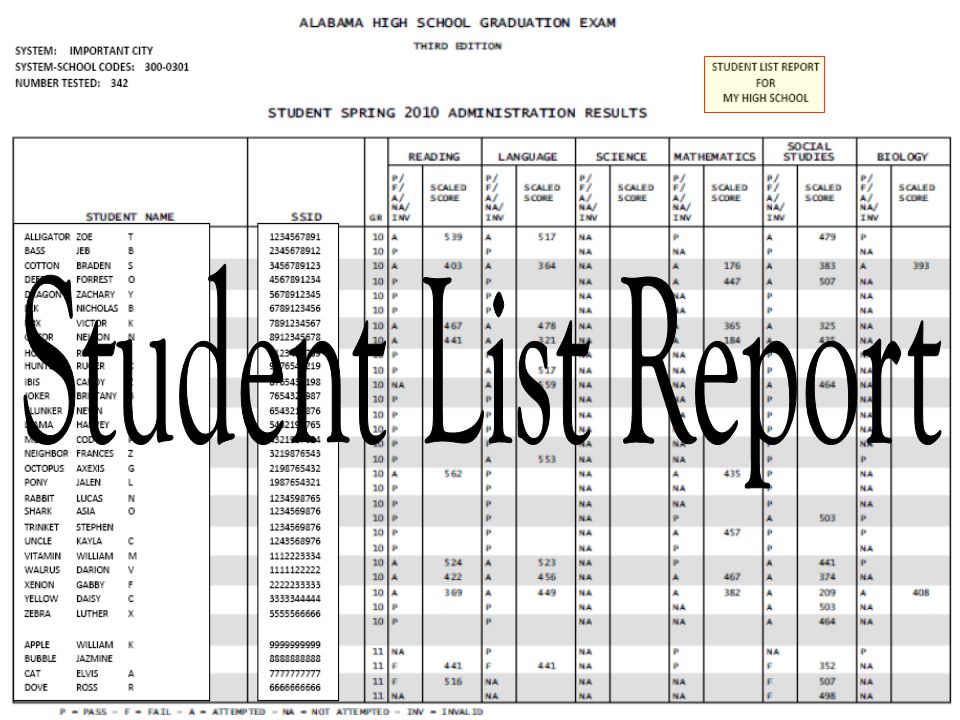
15
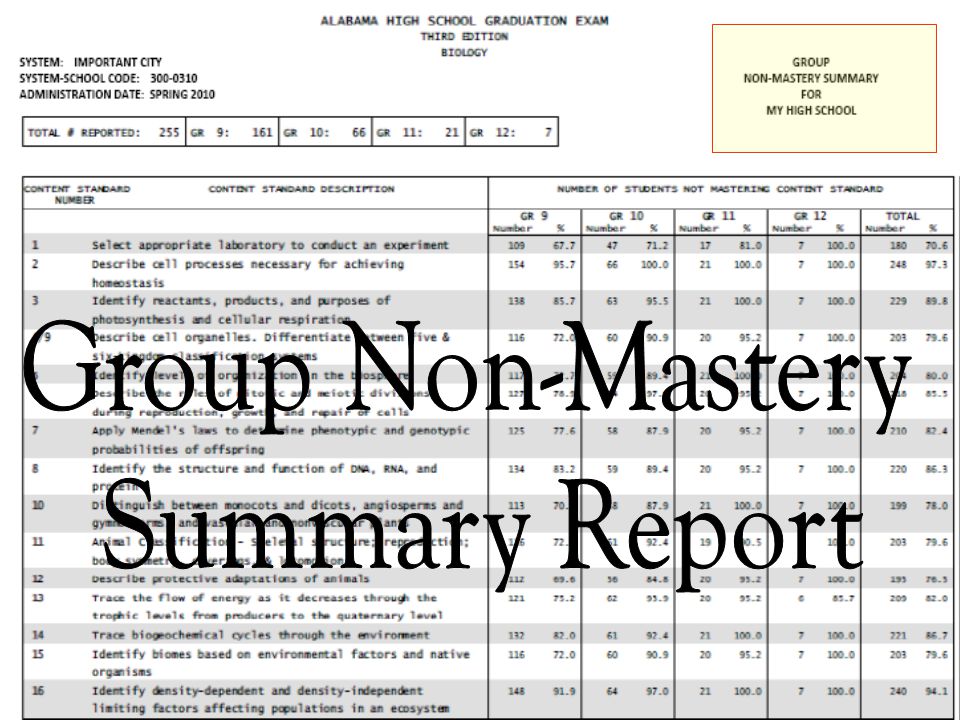
Each content standard number and content standard description is listed on each group non- mastery summary report per sub-test.

16
The number of students not mastering each content standard divided by grade level is listed to the left in each column under the grade level. A total number of all students not mastering each contest standard is also listed in the last column. The percent of students not mastering each content standard divided by grade level is listed to the right of the number of students tested. A total percent of all students not mastering each contest standard is also listed in the last column.

17
Two Sided Report Indicates scores per sub-test unless sub-test is passed

18
System Name School Name School Code Test Date Exam Title Test Edition Report Type Student Name Student ID Number Student DOB Student Grade

19
If the student did not pass a sub-test, the Individual Report will display the students scaled score, the scaled score needed to pass the sub-test will be printed in parenthesis on the same line under the name of the sub-test. DID NOT PASS will be printed under the scaled score information.

20
If the student passed a sub-test, no information about the scaled score will be printed below the sub-test title. PASSED will be printed under the sub-test title.

21
If the student did not take a sub-test, no information about the scaled score will be printed below the sub-test title. NOT ATEMPTED will be printed under the sub-test title.

22
If the student did not pass a sub-test, each objective and objective number will be listed.

23
Item Total: Total number of questions per objective tested for each sub-test.

24
Item Correct: Total number of questions per objective tested for each sub-test that the student answered correctly.

25
Mastery: A dash (-) indicates that the student did not master the objective. A plus sign (+) indicates that the student mastered the objective. Each sub-test not mastered gives the total objectives tested, total items correct, and total number of objectives mastered at the bottom of each sub-test detailed section.
 indicates that the student mastered the objective. Each sub-test not mastered gives the total objectives tested, total items correct, and total number of objectives mastered at the bottom of each sub-test detailed section..")
27
System Name System Code Students Tested Exam Title Test Edition Testing Date/Session Report Type School Name

28
Each student tested, their ID number, and grade level is listed. Students are separated by grade level.

29
Each sub-test is listed and the students results for each sub-test is also listed. A key to help read this part of the report is printed at the bottom of the report.

30
Under each sub-test column, the students scaled score is listed if the sub-test was failed.

32
Testing Date Exam Title Test Edition Type of Report Report Type

33
All sub-test are reported on this report. Each sub- test is divided by grade level.

34
Each sub-test indicates the number and percent of students that passed or failed.

35
How Do I Use These Reports? Make class profile sheets Plan individual remediation Adjust instruction Goal setting Determine the strength of the core program Longitudinal Study for each core subject Prediction for AYP

Similar presentations


 –STAAR Spanish –STAAR A –STAAR L –STAAR Alternate.>")

 –STAAR Spanish –STAAR L –STAAR Modified –STAAR.>")

 November/December 2013 Accountability Services (12-11-13) 1.>")


 When – April (Parent reports – late summer) What – Your child was measured against.>")


