Download presentation
Presentation is loading. Please wait.

1
Food For Thought !

2
Soft Drinks and School-Age Children: Trends Effects Solutions

3
Soft Drinks soda fruit-flavored drinks part-juice drinks sports drinks

4
Soda

5
Other Soft Drinks

8
Soft Drink Sales and Advertising-2000 450 different soft drinks retail sales of over $60 billion advertising budgets Coca Cola - $895 million Pepsi - $2.1 billion National Soft Drink Association - www.nsda.org Advertising Age - www.adage.com

10
Beverages in the U.S. Food Supply (Gallons/Person/Year) Source: U.S. Dept. of Agriculture, Economic Research Service Website Carbonated Soft Drinks Milk 2000

11
Changing Culture

12
Percent of Children Drinking Soft Drinks Daily Source: Washington Post, 2/27/02

13
Soft Drink Contribution to Diets of Adolescents Source: USDA CSFII, !994-96

14
Beverage Consumption of Children and Adolescents in the US, 1994-96 (average quantities [in ounces] per day) Source: USDA CSFII, !994-96
![Beverage Consumption of Children and Adolescents in the US, (average quantities [in ounces] per day) Source: USDA CSFII, !994-96](http://images.slideplayer.com/25/8020282/slides/slide_14.jpg "Beverage Consumption of Children and Adolescents in the US, (average quantities [in ounces] per day) Source: USDA CSFII, !994-96")
15
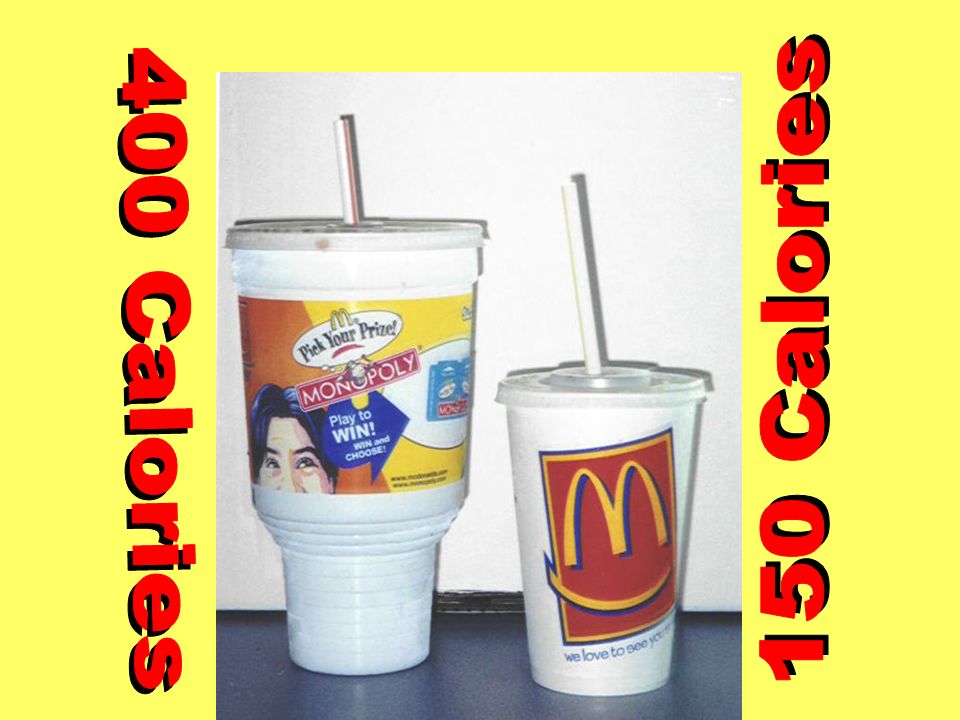
Portion Distortion 6½ ounces 88 calories 12 ounces 160 calories 20 ounces 266 calories 1950s 1980s 2000s

18
Nutrient Composition of Beverages

19
More American children are overweight than ever before 0 2 4 6 8 10 12 14 16 1963-701971-741976-801988-941999

20
Prevalence of Overweight (BMI>=95th Percentile) among White and Black Children by Age North Carolina, 2001 Source: North Carolina-Nutrition and Physical Activity Surveillance System (NC-NPASS) includes data on children seen in North Carolina Public Health Sponsored WIC and Child Health Clinics and some School Based Health Centers. Percentiles were based on the CDC/NCHS Year 2000 Body Mass Index (BMI) Reference
 Reference.")
22
Obesity Trends* Among U.S. Adults BRFSS, 1985 (*BMI 30, or ~ 30 lbs.. overweight for 5’4” woman) Source: Molded AH. No Data 20%
 Source: Molded AH. No Data 20%.")
23
(*BMI 30, or ~ 30 lbs. overweight for 5’4” woman) Obesity Trends* Among U.S. Adults BRFSS, 1986 Source: Mokdad AH. No Data 20%

24
(*BMI 30, or ~ 30 lbs. overweight for 5’4” woman) Obesity Trends* Among U.S. Adults BRFSS, 1987 Source: Mokdad AH. No Data 20%

25
(*BMI 30, or ~ 30 lbs. overweight for 5’4” woman) Obesity Trends* Among U.S. Adults BRFSS, 1988 Source: Mokdad AH. No Data 20%

26
(*BMI 30, or ~ 30 lbs. overweight for 5’4” woman) Obesity Trends* Among U.S. Adults BRFSS, 1989 Source: Mokdad AH. No Data 20%

27
(*BMI 30, or ~ 30 lbs. overweight for 5’4” woman) Obesity Trends* Among U.S. Adults BRFSS, 1990 Source: Mokdad AH. No Data 20%

28
(*BMI 30, or ~ 30 lbs. overweight for 5’4” woman) Obesity Trends* Among U.S. Adults BRFSS, 1991 Source: Mokdad AH. No Data 20%

29
(*BMI 30, or ~ 30 lbs. overweight for 5’4” woman) Obesity Trends* Among U.S. Adults BRFSS, 1992 Source: Mokdad AH. No Data 20%

30
(*BMI 30, or ~ 30 lbs. overweight for 5’4” woman) Obesity Trends* Among U.S. Adults BRFSS, 1993 Source: Mokdad AH. No Data 20%

31
(*BMI 30, or ~ 30 lbs. overweight for 5’4” woman) Obesity Trends* Among U.S. Adults BRFSS, 1994 Source: Mokdad AH. No Data 20%

32
(*BMI 30, or ~ 30 lbs. overweight for 5’4” woman) Obesity Trends* Among U.S. Adults BRFSS, 1995 Source: Mokdad AH. No Data 20%

33
(*BMI 30, or ~ 30 lbs. overweight for 5’4” woman) Obesity Trends* Among U.S. Adults BRFSS, 1996 Source: Mokdad AH. No Data 20%

34
(*BMI 30, or ~ 30 lbs. overweight for 5’4” woman) Obesity Trends* Among U.S. Adults BRFSS, 1997 Source: Mokdad AH. No Data 20%

35
(*BMI 30, or ~ 30 lbs. overweight for 5’4” woman) Obesity Trends* Among U.S. Adults BRFSS, 1998 Source: Mokdad AH. No Data 20%

36
(*BMI 30, or ~ 30 lbs. overweight for 5’4” woman) Obesity Trends* Among U.S. Adults BRFSS, 1999 Source: Mokdad AH. No Data 20%

37
(*BMI 30, or ~ 30 lbs. overweight for 5’4” woman) Obesity Trends* Among U.S. Adults BRFSS, 2000 Source: Mokdad AH. No Data 20%

38
Health Implications

40
There is a direct link between good nutrition and the ability to learn, play, grow and develop. Well nourished children have higher test scores, better school attendance and fewer behavioral problems. Schools are important environments that impact children’s nutritional intake. Schools Can Make a Difference

41
USDA Regulations USDA has established regulations to control the sale of foods of minimal nutritional value in the food service area during school meal periods. Foods included in this regulation include: carbonated beverages hard candies flavored ices chewing gum

42
North Carolina Policies All a la carte food and beverages sold in the school cafeteria must contribute to the nutritional well being of the child and aid in establishing good eating habits.

43
Soft Drinks In Schools North Carolina general statue 115C-264 states that each school may, with the approval of the local board of education, sell soft drinks to students as long as soft drinks are not sold: during the lunch period at elementary schools contrary to the requirements of the school lunch program

46
Pouring Rights Contracts A contract with a soft drink company for the sole sale of one brand. A significant part of the funding comes in an immediate lump sum with subsequent revenues tied to sales.

48
Vending Machine Placement and Operation Elementary students should not have access to food or beverages in vending machines.

49
Vending Machine Placement and Operation Off during school hours - or at least until the end of the last lunch period Out-of-the way places - far from the dining areas

50
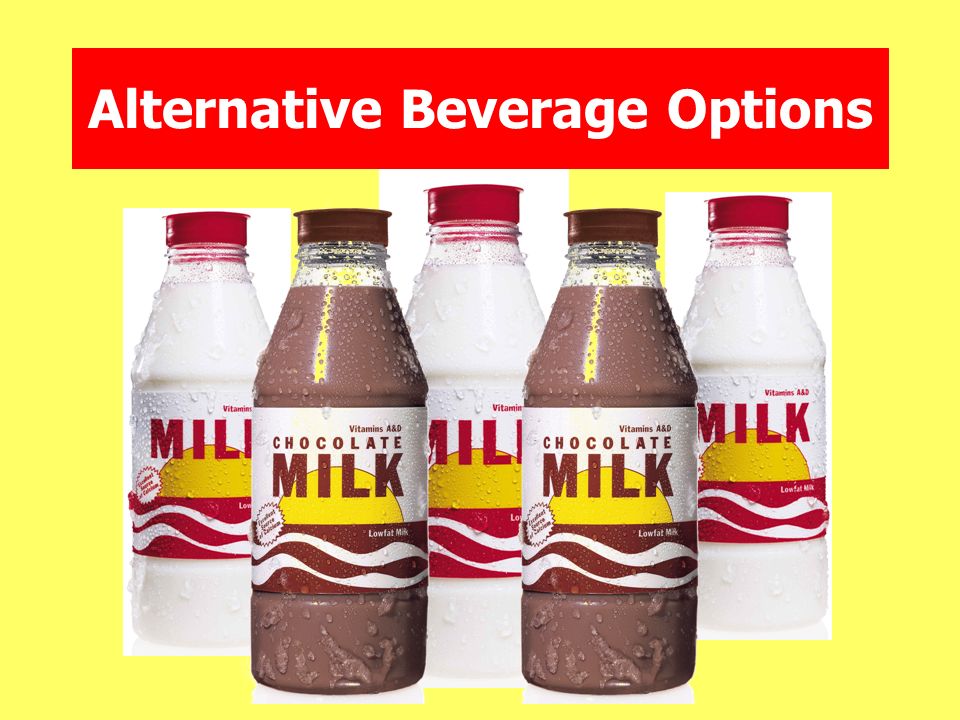
Alternative Beverage Options

54
Alternative Vending and Promotion Options

56
Advocating for a Healthful School Nutrition Environment...

57
Writing Prompt Write two eight sentence chunk paragraphs on how you view the nutritional choices available to you during your day both at school and out of school. Include your reaction to the points made in this power point. Do you agree or disagree and why? Please post your full name, date and class period in the upper right hand corner.

Similar presentations


 and understand its scope and effects Share who some of the.>")

 A guide for making healthy food choices Recently redesigned >")


