Download presentation
Presentation is loading. Please wait.

1
Meteorologisches Observatorium Hohenpeißenberg VOC MEASUREMENTS AT HOHENPEISSENBERG AS PART OF THE GAW PROGRAM Christian Plass-Dülmer and Harald Berresheim Meteorologisches Observatorium Hohenpeißenberg, DWD, Germany

2
GAW expert meeting Report 111, 1995 Global distribution, seasonality and trends understanding the biogeochemical cycling (sources, sinks, chemistry) impact on ozone, photooxidants, oxidising capacity, aerosol, climate, health WMO (1995): WMO-BMBF Workshop on VOC - Establishment of a World Calibration/Instrument Intercomparison Facility for VOC to Serve the WMO Global Atmosphere Watch (GAW) Programme, WMO Report, 111. EMEP Strategic Plan 2004 European distribution and trends Compliance monitoring (compliance with protocols) understand physical and chemical processes Support for EMEP model EMEP (2003): The EMEP Monitoring Strategy 2004-2009 - Background document with justification and specification of the EMEP monitoring programme 2004-2009, eds. Kjetil Torseth and Oystein Hov, EMEP, CCC-Report 9/2003. VOC Monitoring - Objectives
 understand physical and chemical processes Support for EMEP model EMEP (2003): The EMEP Monitoring Strategy Background document with justification and specification of the EMEP monitoring programme , eds. Kjetil Torseth and Oystein Hov, EMEP, CCC-Report 9/2003. VOC Monitoring - Objectives.")
3
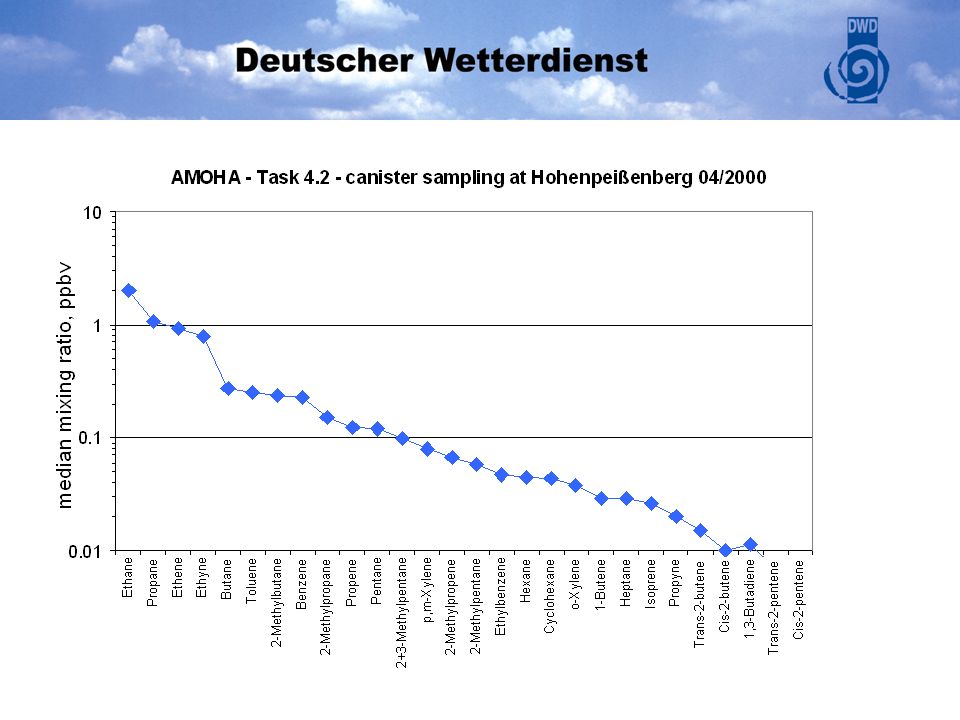
GAW-Program VOC: Stage 1: C 2 -C 9 hydrocarbons HC Stage 2: C 10 -C 14 HC (biogenic) Stage 3: oxygenated VOC (OVOC) MOHp GC-FID GC-MS/FID GC-PDHID/FID Detection limits: 1 ppt... 10 ppt Accuracy: C 2 -C 9 HC 5-25%, Terpenes 20-40% QA and QC Procedures VOC Intercomparisons: NOMHICE, AMOHA, and GAW Measurements at 1:00 and 13:00 CET ca. 80 VOC

5
70 % of data fulfil GAW - Quality Objectives

6
VOC - Trends at Hohenpeissenberg

7
Biogenic VOC at Hohenpeißenberg monthly means of noon-time concentrations (preliminary data)
")
8
Summer ratio day/night: t [OH] = 1-4 10 10 s molec/cm³ c(day) = c(night) exp(-k[OH] t) Annual cycles of noon- and midnight monthly mean concentrations
![Summer ratio day/night: t [OH] = s molec/cm³ c(day) = c(night) exp(-k[OH] t) Annual cycles of noon- and midnight monthly mean concentrations](http://images.slideplayer.com/3/801490/slides/slide_8.jpg "Summer ratio day/night: t [OH] = s molec/cm³ c(day) = c(night) exp(-k[OH] t) Annual cycles of noon- and midnight monthly mean concentrations")
9
Turn over-rates due to reactions with OH radicals Jun-Aug Dec-Feb, 10 10 6 molecules/(cm³s) 3.5 10 6 molecules/(cm³s) (2004 data at noon time and measured OH)
 molecules/(cm³s) (2004 data at noon time and measured OH)")
10
trends and distribution HC, OVOCs oxidizing capacity VOC turn-over, radical precursors aerosol formation and growth semi-volatile prod. oxidant formation VOC turn-over source attribution tracer, signature Isoprene, monoterpenes, light alkenes, formaldehyde semi-volatile products of monoterpenes and aromatics various C2-C10 hydrocarbons, OVOCs and halogenated VOC Research Topics at Hohenpeißenberg with respect to VOC

11
scientific user: analyse spatial distributions and temporal evolution, sources and sinks Future Requirements (presented at GAW workshop Tutzing 2004) SAG: establish DQOs, QA/QC procedures, Pilot stations, SOPs, error assessment QA/SAC: support SAG, WCC, and stations; motivate and coordinate WCC: continue audits+intercomp., provide standards, SOPs, error assessment, data evaluation Stations: report VOC+errors to WDCGG/EMEP all: workshops/conferences to communicate
 SAG: establish DQOs, QA/QC procedures, Pilot stations, SOPs, error assessment QA/SAC: support SAG, WCC, and stations; motivate and coordinate WCC: continue audits+intercomp., provide standards, SOPs, error assessment, data evaluation Stations: report VOC+errors to WDCGG/EMEP all: workshops/conferences to communicate")
12
Annual Cycles of OVOCs at Hohenpeissenberg

13
GC-2 Varian 3400CX MS/FID C5-C14 Hydrocarbons Halocarbons Oxygenated VOC

14
GC-1 Varian 3600CX, FID C2-C8 Hydrocarbons

15
Glass-Sampling Line

17
VOC patterns of boundary-layer and free troposphere air 1101001000 Ethan Propan i-Butan n-Butan i-Pentan n-Pentan 2-M-Pentan n-Hexan n-Heptan Ethen Propen 1,3-Butadien Isopren Acetylen Propin Benzol Toluol Ethylbenzol p,m-Xylol o-Xylol Mixing ratios, pptv Boundary-layer Free troposphere Photochemical age: about 8 days

18
Box: OH O 3 VOC-emissions = const. Atmosphere T-Winter MR-Winter =1/(K[OH]+k[O 3 ]) T-Summer MR-Summer = Annual Cycle: Winter-Summer Ratios of selected VOC OH O3 Nov-Feb 0.2E6 cm - ³ 32 ppb Jun-Aug 1.7E6 cm - ³ 51 ppb 1 10 Ethan Propani-Butan n-Butan i-Pentan n-Pentan Ethen Propen t-2-Buten 1-Buten 1,3-Butadien Acetylen Propin Benzol Toluol p,m-Xylol Ratios Winter/Summer X Measurement Lifetime Despite of chemical impacts, sources and meteorology are important
 T-Summer MR-Summer = Annual Cycle: Winter-Summer Ratios of selected VOC OH O3 Nov-Feb 0.2E6 cm - ³ 32 ppb Jun-Aug 1.7E6 cm - ³ 51 ppb 1 10 Ethan Propani-Butan n-Butan i-Pentan n-Pentan Ethen Propen t-2-Buten 1-Buten 1,3-Butadien Acetylen Propin Benzol Toluol p,m-Xylol Ratios Winter/Summer X Measurement Lifetime Despite of chemical impacts, sources and meteorology are important.")
20
Mixing Ratios 1998 vs. reactivity with OH

21
0 200 400 600 800 1000 -10-5051015202530 Temperature, °C Mixing Ratio, pptv Sum of TerpenesIsoprene ---> Emission driven by temperature (meteorology) ---> Ozone-smog ---> climate ! ---> Particle-formation Biogenic Emissions - mixing ratios versus temperature

22
Do we see changes in the composition of anthropogenic VOC? Trends are still uncertain due to the short observation periode!

23
C2-C7 n-alkanes C4-C7 i-alkanes C2-C6 alkenes C7-C8 aromatics

24
GAW stage 1: C 2 -C 9 hydrocarbons stage 2: C 10 -C 14 hydrocarbons stage 3: oxygenated VOC establish 3 pilot stations VOC Monitoring Program NMHC Measurements by GC/FID - canister / on-line EMEP level 2: C 2 -C 7 hydrocarbons level 2: C 1 -C 6 carbonyls level 3: C 6 -C 12 hydrocarbons level 2 = approx 15 sites level 3 = research stations GAW/EMEP: 30 target compounds C2-C9

25
accuracy NMHC: 10 - 20 % VOC Data Quality Objectives accuracy NMHC 15-25% GAW Report 111,... Intercomp.+audits by WCC training (GAWTEC) VOC QA / QC EMEP Manual (EMEP/CCC-1/95) intercomp.+audits by NILU data screening by NILU and local laboratories no calibration gas standards no QA / QC protocol SOPs ?
 VOC QA / QC EMEP Manual (EMEP/CCC-1/95) intercomp.+audits by NILU data screening by NILU and local laboratories no calibration gas standards no QA / QC protocol SOPs .")
26
Yearly Trend of anthropogenic VOC: Measurements and Estimates (National Emission-Inventory Germany - 2002, UBA, 31/07/03) DWD Hohenpeißen- berg UBA/EMEP Waldhof estimated emissions (UBA ) estimated emissions (UBA ) 1998-20031992-20021990-20012000-2001 Measurements-4%-5% Transport Emissions-12%0% total (without solvents)-10%0%
 DWD Hohenpeißen- berg UBA/EMEP Waldhof estimated emissions (UBA ) estimated emissions (UBA ) Measurements-4%-5% Transport Emissions-12%0% total (without solvents)-10%0%")
27
Plass-Dülmer und Berresheim, Meteorologisches Observatorium Hohenpeißenberg

28
Annual winter (Nov-Feb) median concentrations of hydrocarbons at Waldhof (DE), Kosetice (CZ) and Donon (FR), red letters are results by NILU analysis, blue by national lab. Reference: VOC Measurements 2002 Sverre Solberg, NILU, Kjeller, Norway EMEP / CCC-Report 8/2004 Reference O-92016

29
Mixing ratios 1998 versus reactivity towards OH

30
QC - Recent International Intercomparison Experiments NOMHICE - NonMethane Hydrocarbon InterComparison Experiment Tasks 1 - 5 (Apel et al., JGR, 1994, 1999, 2003) AMOHA - Accurate Measurements of Hydrocarbons in the Atmosphere Tasks 1 - 3 (Slemr et al., 2002) Task 4 (Plass-Dülmer et al., in preparation) First GAW - WCC - VOC - Intercomparison 2003 B. Rappenglück et al. NOMHICE: analytical preformance of participating labs AMOHA: analytical preformance + canisters + sampling procedure GAW-WCC: analytical preformance + on-line / canister

31
First GAW - VOC Intercomparison 2003 Task-1: Synthetic Mixture (73 components, 0.2-10 ppb) Task-2: ambient air - parallel sampling participant / WCC Task-1 62 % within Data Quality Objectives (30 Target Compounds) See poster by Rappenglück et al.
 Task-2: ambient air - parallel sampling participant / WCC Task-1 62 % within Data Quality Objectives (30 Target Compounds) See poster by Rappenglück et al.")
32
VOC Monitoring in Europe - EMEP network (since 1992) Mace Head, since 2001 ? Pallas, since 1992 Hohenpeissenberg, since 1998 Izana, no VOC GAW Global Stations Birkenes Zeppelin

33
VOC Distribution (median) in Winter-Months 2002 (EMEP VOC Report, 2004) Lifetime: ca. 60 days
 in Winter-Months 2002 (EMEP VOC Report, 2004) Lifetime: ca. 60 days")
34
EMEP Trend Results no clear trends in Northern Europe (Finnish sites) decreasing concentrations in Central Europe (20-50% / 1992-2000) and a levelling off after 2000 Caution: Trends are uncertain
 decreasing concentrations in Central Europe (20-50% / ) and a levelling off after 2000 Caution: Trends are uncertain")
35
Summary GAW and EMEP: similar objectives, VOC compounds, and QA /QC Results of European monitoring: - higher concentrations in Central and Eastern Europe - trends of anthr. VOC in Central Europe by 0-10% / year VOC intercomparisons: - Data Quality Objectives are met by 2/3 of results - data quality varies substantially from lab to lab - problem: error assessment (DQO) European VOC monitoring is mainly provided by EMEP
 European VOC monitoring is mainly provided by EMEP.")
Similar presentations


 Programme Leonard Barrie Chief,>")

 Mike Jenkin EMMA Group Department of Environmental Science and Technology>")


 and its development protocols Mike Jenkin EPSR Group Department of Environmental Science and Technology.>")


