Download presentation
Presentation is loading. Please wait.

1
Flemingsburg Elementary January 14, 2015

2
YearOverall Score Percentile In KY ClassificationCategory 2013-1466.055Needs Improvement Progressing N/A 2012-1357.823N/A Needs Improvement - Below 70th Percentile Progressing – - Meet AMO goal - Meet graduation rate goal - Meet participation rate (95%)
")
3
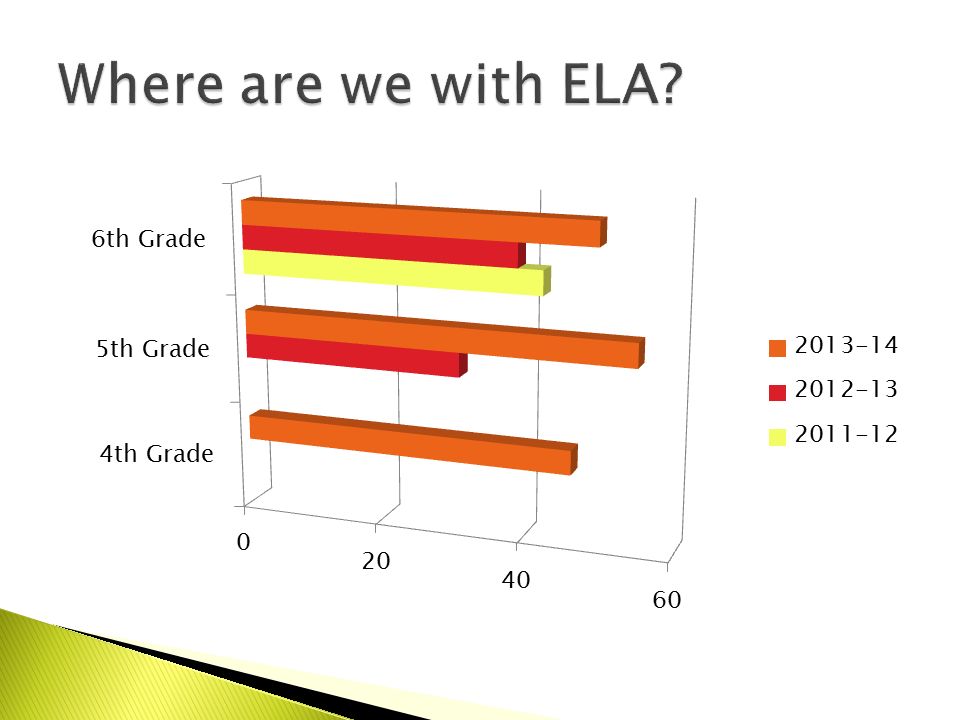
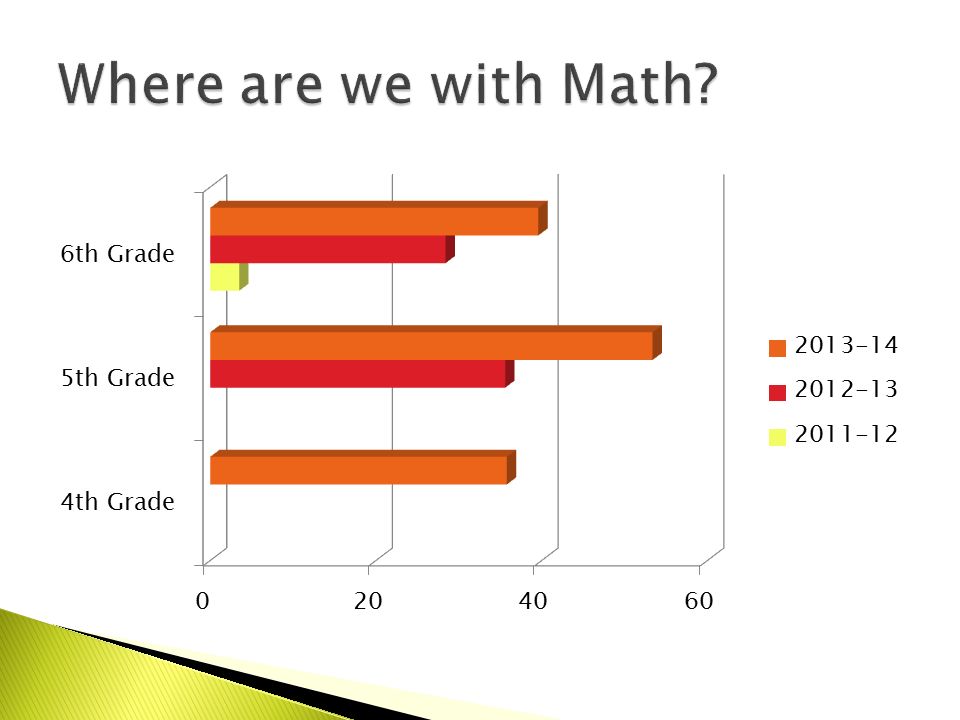
YearNGL Total Weighted Score PR Total Weighted Score Combined Score 2013-1459.946.12386.319.84966.0 2012-1352.940.73374.217.06657.8 Subject2012-132013-14 Reading41.453.7 Math30.747.3 Science57.979.5 Social Studies61.539.6 Writing31.737.0 Language Mech40.854.2

6
Growth % Students making typical or higher growth ReadingMathCombined FES62.670.366.5 State59.659.959.8

10
Rigorous curriculum. Shifting the focus to student centered instruction. School-wide writing initiative: Four Square Writing Data driven decision making. .

11
Building Capacity: Teacher Leadership Raise Performance Expectations Holding ALL Accountable Restructuring our PLC Process (School- wide and grade level) Working with parents and community partners
 Working with parents and community partners")
12
Parent Teacher Conferences Parent Teacher Organization Meetings Open Houses Web Page Monthly Parent E-News Letters Social Media

13
Systems approach is in place for designing and modifying instruction. Clear instructional focus that is based on student centered instructional practices. Instructional strategies are clearly planned and designed to meet the needs of our students. A building composed of teacher leaders. ALL teachers have taken ownership of the outcome of EVERY student. BEING A SCHOOL OF DISTINCTION

Similar presentations


 Mathematics and Science Partnership - Maine U.S. Department of Education MSP Regional Meeting.>")
 Next Generation Support (23%) Next Generation Professionals (10%) Next Generation.>")


