Download presentation
Presentation is loading. Please wait.

1
2013-14 School Year

2
Unbridled Learning Next Generation Learners (100%) Next Generation Support (23%) Next Generation Professionals (10%) Next Generation Schools and Districts 2012-20132013-20142014-2015 ? -Achievement -Gap -Growth -Readiness for College /Career -Graduation Rate Program Reviews PL/CS, Writing, The Arts K-3 added 14-15; World Language HS Percent Effective Teachers Percent Effective Leaders = Overall Accountability Score

3
AchievementGapGrowthCCRGrad Rate ELEMKPREP: Reading, math, ss, science, writing All Tested Areas Reading and Math N/A MSKPREP: Reading, math, ss, science, writing All Tested Areas Reading and Math ExploreN/A HSEnd of Course and On- Demand Writing PLAN to ACT Reading & Math College and Career Rate AFGR/ Cohort Model

4
AchievementGapGrowthCCRGrad Rate ELEM30% 40%-- MS28% 16% HS20% Within Achievement and GAP—all areas are weighted equally except writing and language mechanics are split 16%/4%. Growth includes Math and Reading only—K-8 from KPREP; HS from Plan to ACT.

5
The Test and Content Across the board 3-12 everyone tested the same.

6
Scores include program reviews statewide ◦ That means…the School Report Card now has different scores in it from last year. Can’t compare the overall scores—they will be quite a bit higher. CAN compare individual area scores for each area (Achievement, Gap, Growth, proficiency of students, and other measures)
.")
7
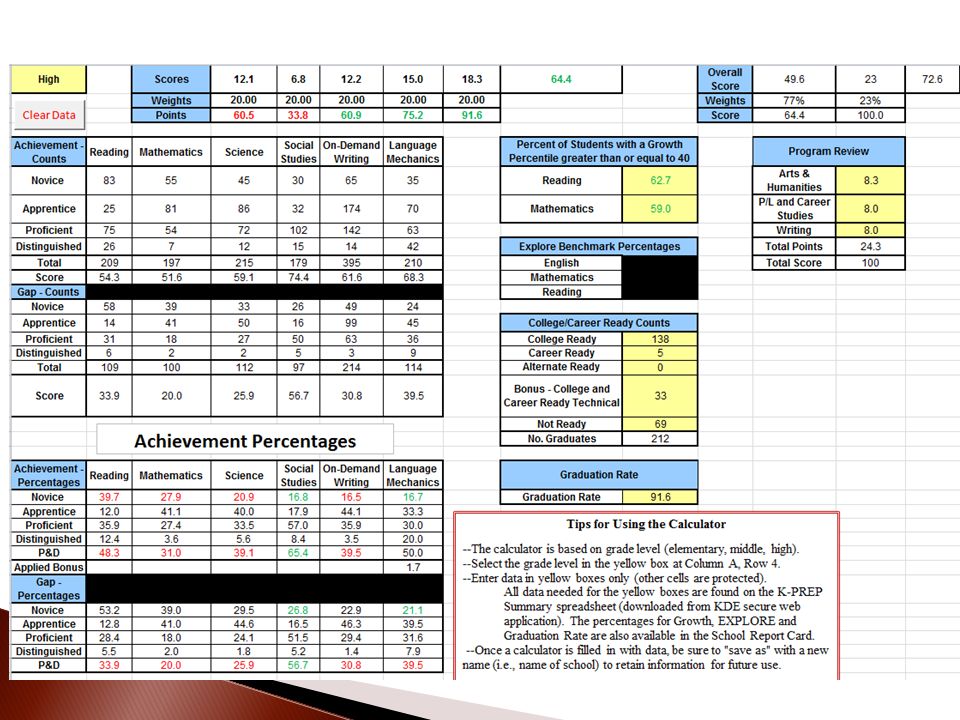
Locked Proficient and Distinguished Levels for this year, will change next year ◦ Elementary: 62.5, 69.8 ◦ MS: 58.7, 64.9 ◦ HS 58, 64.4 Progressing: Made AMO (Annual Measurable Objective)—our Annual Goal for progress. High Performing School (90 th percentile) School of Distinction (95 th percentile) High Progress (Top 10% of improvement) Priority and Focus (lowest 10%, below 3 rd SD in an area)
 School of Distinction (95 th percentile) High Progress (Top 10% of improvement) Priority and Focus (lowest 10%, below 3 rd SD in an area).")
8
Public reporting in the paper used a shortened ranking system; I used an extended ranking system to stick with the number of schools/districts Provides basis for comparison for consistency Information about how well are we adapting to CCSS compared to others District School Rank/Labels

9
Overall Score 69.7* AMO 69.8 62/173 Districts 32/174 last year 83 rd Percentile per reporting *cannot be compared to previous year score

10
Clark 95/173 ◦ 74/174 Fayette 97/173 ◦ 62/174 Harrison 86/173 ◦ 105/174 Jessamine 66/173 ◦ 99/174 Mason 91/173 ◦ 115/175 Mercer 114/173 ◦ 93/174 Montgomery 29/173 ◦ 29/174 Nicholas 160/173 ◦ 111/174 Paris 139/173 ◦ 143/174 Pendleton 102/173 ◦ 121/174 Scott 57/173 ◦ 58/174 Madison 48/173 ◦ 70/174 Boyle 6/173 ◦ 12/174

11
Each school’s ranking among their grade span Label AMO status ◦ Proficient schools expected to make.5 gain ◦ Needs improvement schools expected to make 1 point gain.

12
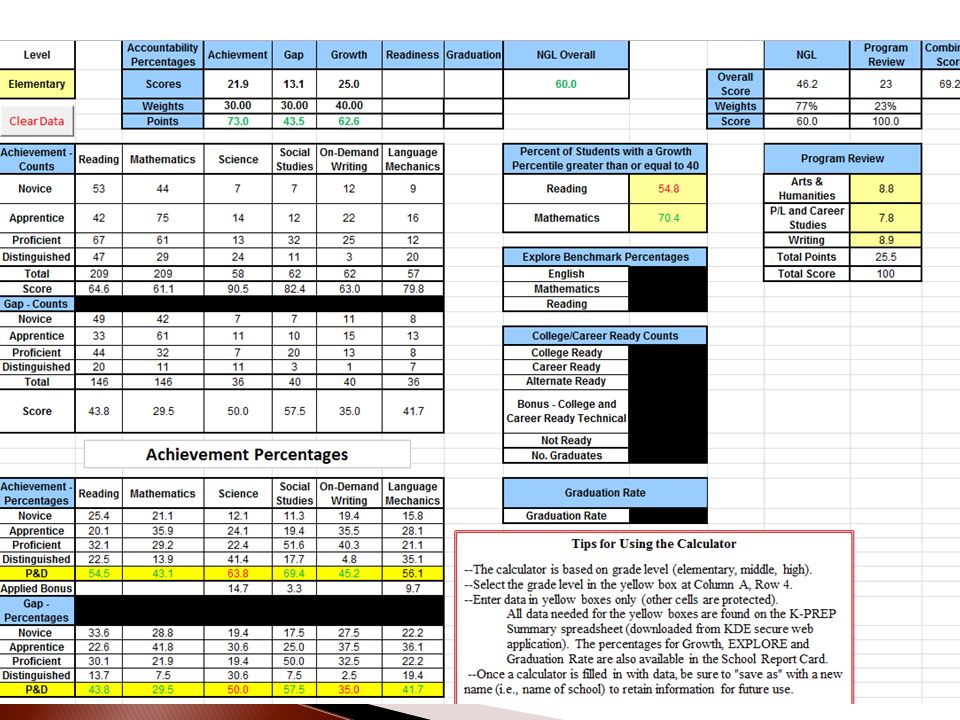
Cane Ridge 353/720 ◦ 366/739 last year ◦ Needs Improvement ◦ Did not make AMO Overall 69.2 (AMO 69.4)
")
14
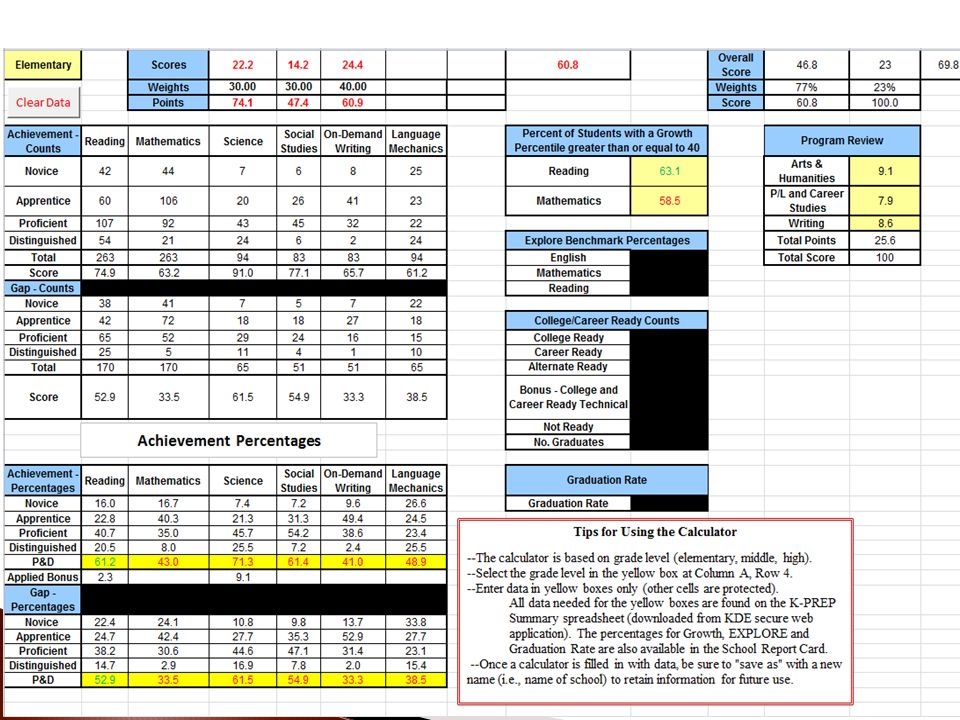
Bourbon Central332/720 ◦ 231/739 last year ◦ Proficient School ◦ Did not make AMO Overall 69.8 (AMO 72.0)
")
16
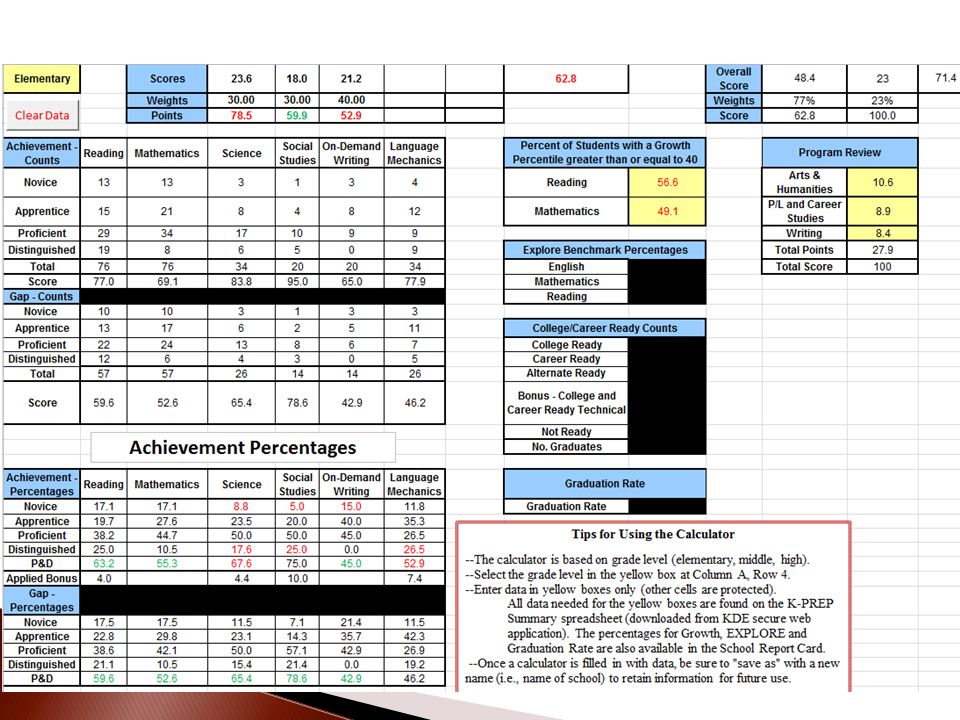
North Middletown 274/720 ◦ 86/739 last year ◦ Proficient School ◦ Did not make AMO 71.4 (AMO 76.5)
")
18
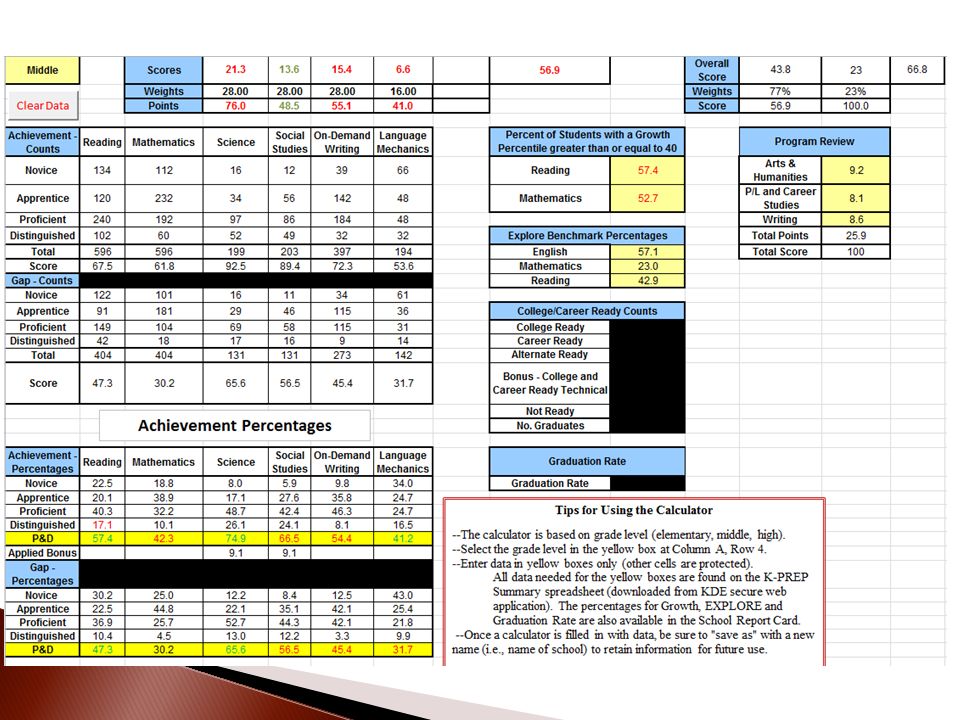
Middle School 153/330 ◦ 80/328 last year ◦ Proficient School ◦ Did not make AMO 66.8 (AMO 68.2) ◦ Focus School (Disbability/Science and Reading)— Not New, Carryover because did not meeting AMO
 ◦ Focus School (Disbability/Science and Reading)— Not New, Carryover because did not meeting AMO")
20
High School96/229 ◦ 97/232 last year ◦ Proficient School, Progressing (Met AMO) AMO 70.4 ◦ Focus School (Disability/Writing)—New Designation
 AMO 70.4 ◦ Focus School (Disability/Writing)—New Designation")
22
Professional Learning Communities—Improve Student learning Work toward meeting AMO Move to Distinguished Status Remove Focus School Status

Similar presentations
 Information August 6,2013.>")


 Office of Assessment and Accountability 10/23/12 1 Assessment and Accountability Update.>")
 1 Hal Sanderson, Ph.D. Research and Assessment August 21, 2013 2013.>")


: A Comprehensive Measurement System for All Schools Student Achievement (e.g. PSSA) Student Progress.>")


