Download presentation
Presentation is loading. Please wait.

1
WHAT “CATCH” MEANS IN ENVIRONMENTAL CONTEXT? Sachiko TSUJI (FAO) 30/10-01/11/2012 UNECE TF on Environmental Indicators
 30/10-01/11/2012 UNECE TF on Environmental Indicators.")
2
30/10-01/11/2012 UNECE TF on Environmental Indicators How “catch” is determined – meaning of catch Detailed definition of catch Indication of “catch” in a context of monitoring “environment” - We cannot see underneath of water – limitation in available information; invisible, less noticeable - Aquatic – terrestrial biological dynamics – no difference in principle

3
30/10-01/11/2012 UNECE TF on Environmental Indicators Senior Fishery Statistician of FAO Responsible for all Fishery and Aquaculture statistics disseminated from FAO Participated in development of UN SEEA, CBD - aquatic Secretary of Coordinating Working Party on Fishery Statistics (CWP) FAO Statutory global coordinating mechanism - 22 organizations as members Objectives - set up standards, concepts and classifications for fisheries statistics, review information needs, coordination for research and collaboration Personal background – population dynamics
 FAO Statutory global coordinating mechanism - 22 organizations as members Objectives - set up standards, concepts and classifications for fisheries statistics, review information needs, coordination for research and collaboration Personal background – population dynamics")
4
Dynamics on aquatic stocks, fishing activities, catch and environmental impacts. What “catch” means ?

5
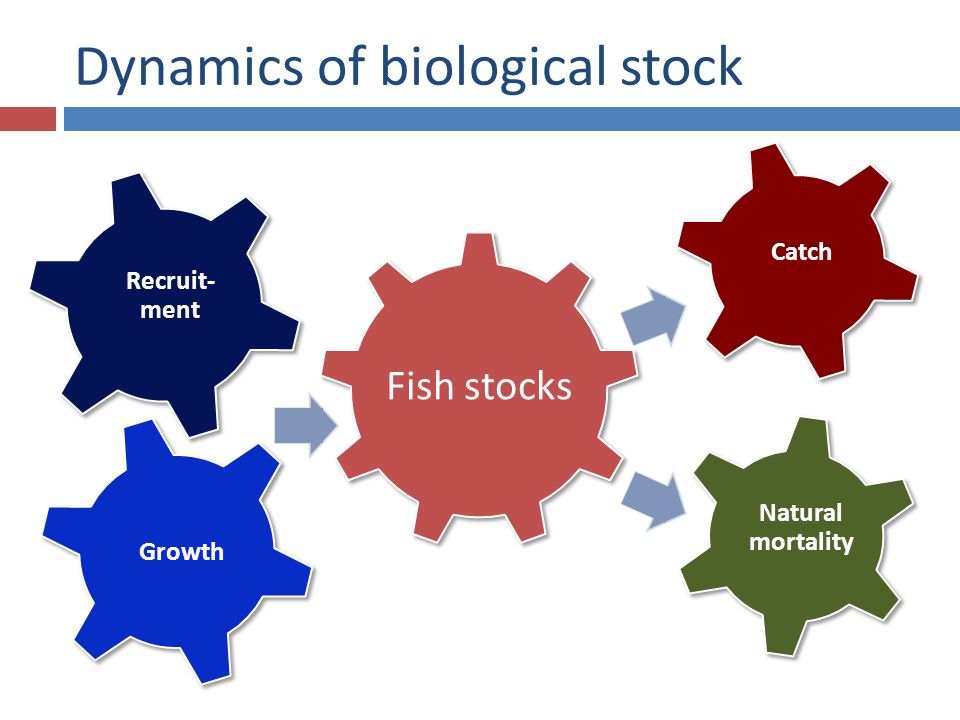
Dynamics of biological stock

7
Catch diagram # boats; Gear technology; Fishing Days ENSO events; Climate changes impacts, CATCH = [Fishing Effort] * [Fish abundance available to fishing]
![Catch diagram # boats; Gear technology; Fishing Days ENSO events; Climate changes impacts, CATCH = [Fishing Effort] * [Fish abundance available to fishing]](http://images.slideplayer.com/25/7863428/slides/slide_7.jpg "Catch diagram # boats; Gear technology; Fishing Days ENSO events; Climate changes impacts, CATCH = [Fishing Effort] * [Fish abundance available to fishing]")
8
Sustainable Yields Stock Abundance Catch Sustainable Yields Fishing Efforts

9
Catch diagram Urbanization; Water front development; Pollution # boats; Gear technology; Fishing Days ENSO events; Climate changes impacts, CATCH = [Fishing Effort] * [Fish abundance available to fishing]
![Catch diagram Urbanization; Water front development; Pollution # boats; Gear technology; Fishing Days ENSO events; Climate changes impacts, CATCH = [Fishing Effort] * [Fish abundance available to fishing]](http://images.slideplayer.com/25/7863428/slides/slide_9.jpg "Catch diagram Urbanization; Water front development; Pollution # boats; Gear technology; Fishing Days ENSO events; Climate changes impacts, CATCH = [Fishing Effort] * [Fish abundance available to fishing]")
10
Dynamics of biological stock

11
Dynamics of biological stock -- Impacts of habitat destruction

12
Dynamics of biological stock -- Combination with aquaculture Removal of predators; Fertilizing; Blocking fish moves Release of farmed seeds

13
30/10-01/11/2012 UNECE TF on Environmental Indicators Multi-species context Single population theories not applicable to multi species context: Too complex for modeling Generally lower suitable harvest point; conflict between over- exploited primary species.vs. under-exploited secondary species “Fished – down” – size change Big fish and commercially high valued fish removed, first Size of fish getting smaller – matured at small size with young age; fish becoming thin > lower productivities “Fished – down” – change in species composition Moving to alternative less preferable species Lowering average trophic level

14
Small scale.vs. large scale

15
Identifying measurement and indicators suitable to monitor target events What to measure ?

16
30/10-01/11/2012 UNECE TF on Environmental Indicators Selection criteria of indicators: Directly measurable, not abstractive concepts: Sensitive and responsive to change in targets: Clear reflective relation to behavior of targets; Cost-effective: Robust and less sensitive to noise: Consistent with public understandings and technical indications: Adequate time-series:

17
Concept of catch Diagram Fish Encountering Gear GROSS REMOVAL GROSS CATCH RETAINED CATCH LANDINGS Live Escapement Pre-catch Losses Discards: Live / Dead Losses and gains prior to landing (e.g. handlings, processing) Not for landings (dumps, substantial uses) Landing * Conversion factors > NOMINAL CATCH
 Not for landings (dumps, substantial uses) Landing * Conversion factors > NOMINAL CATCH.")
18
30/10-01/11/2012 UNECE TF on Environmental Indicators Currently available data and indicators Contribution to food security -- FAO Catch by species and species groups : Retained catch < converted from Landings Trades, disposition by species and species groups Stock assessment / management purpose -- Regional Fishery Management Organizations (RFMOs) Gross removal (including discards), species-specific Stock indicator – e.g. catch taken by unit effort (CPUE) Stock assessment results of species under management Inventories and summary of stocks assessment results – FAO SOFIA / FIRMS; ICES
 Stock assessment results of species under management Inventories and summary of stocks assessment results – FAO SOFIA / FIRMS; ICES.")
19
30/10-01/11/2012 UNECE TF on Environmental Indicators Currently available data and indicators Stocks status as macro-indicators Average trophic level – EU Indicators Gross removal adjusted with effort indicator (quasi-CPUE) – SEEA Bio-diversity – CBD for aquatic (FAO) in pipeline List of aquatic species captured as well as farmed: survey questionnaires in preparation RFMOs – observer data on incidental-catch, discards, of ecologically related species and vulnerable ecosystem species List of Protected Areas
 – SEEA Bio-diversity – CBD for aquatic (FAO) in pipeline List of aquatic species captured as well as farmed: survey questionnaires in preparation RFMOs – observer data on incidental-catch, discards, of ecologically related species and vulnerable ecosystem species List of Protected Areas")
20
30/10-01/11/2012 UNECE TF on Environmental Indicators UNECE members – data reporting status In general, good data quality and species breakdown; Belarus, Finland, Kazakhstan, FYR Macedonia, Russian; Serbia, Ukraine Recently, struggle in communication: No reporting – Armenia (2005), Bosnia and Herzegovina (2007); Georgia (2005, except marine capture in 2010); Turkmenistan (2005); Uzbekistan (2010) Some component systematically not reported: Belgium (inland aquaculture); Moldova (no aquaculture since 2005); Montenegro (aquaculture); Tajikistan (no capture since 2005) Some incomplete or inconsistent among years; Azerbaijan; Kyrgyzstan;
, Bosnia and Herzegovina (2007); Georgia (2005, except marine capture in 2010); Turkmenistan (2005); Uzbekistan (2010) Some component systematically not reported: Belgium (inland aquaculture); Moldova (no aquaculture since 2005); Montenegro (aquaculture); Tajikistan (no capture since 2005) Some incomplete or inconsistent among years; Azerbaijan; Kyrgyzstan;")
21
30/10-01/11/2012 UNECE TF on Environmental Indicators Points for consideration: Indicators of human pressure on environments – important: Fishing pressure, small and large scale operations Non-fishery human activity pressure – no indicator available Impacts of human intervention – stocking, landscaping, protected area Clarify the monitoring target: Not possible to monitor biodiversity and human pressure on aquatic environments with one indicator Direct measurement better than indirect indicators – e.g. for pressure on aquatic environment, energy use in fishing Clarify a link with policy decision – interpretation and actual utilization Avoid duplication and build upon available resources: Enhancing overall monitoring capacity Rebuilding historical assessment

22
Thank you for your attention!!

Similar presentations


 Fisheries Department FOOD AND AGRICULTURE ORGANIZATION OF THE UNITED NATIONS.>")


 under the MSFD was defined as “Populations of all commercially exploited fish and shellfish.>")


