Download presentation
Presentation is loading. Please wait.

1
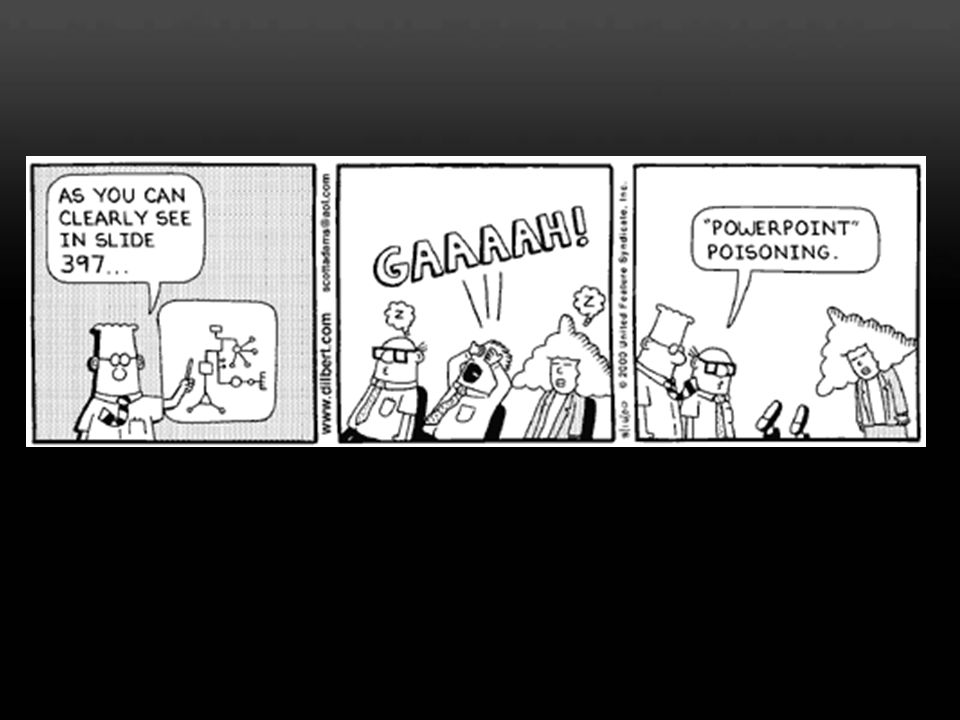
PowerPoint: avoiding death by bullet point
Adam Warren

4
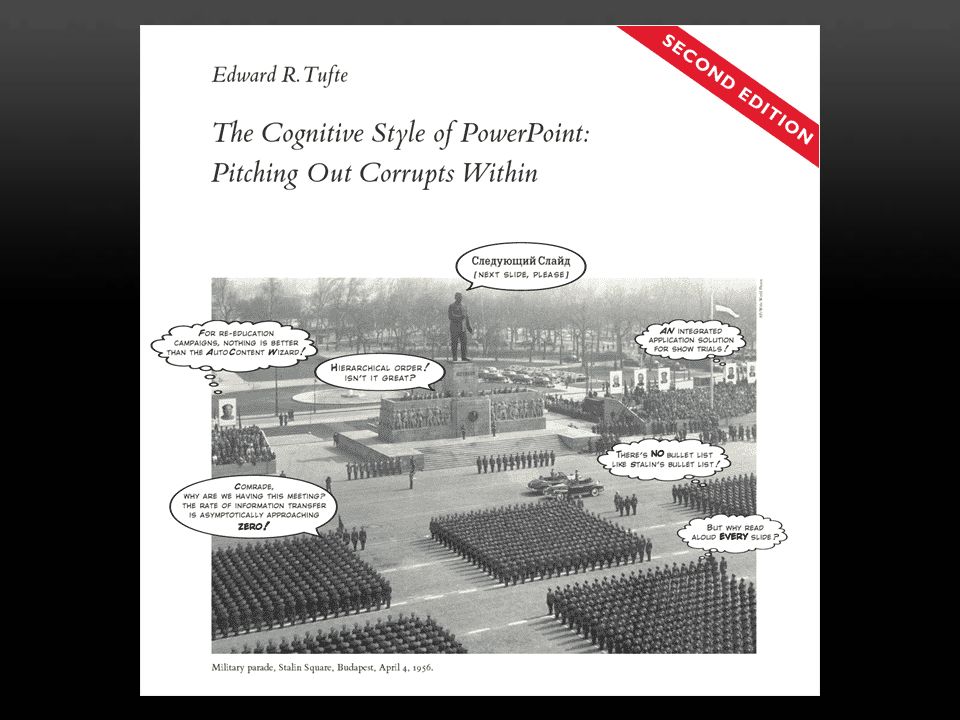
Edward Tufte "Particularly disturbing is the adoption of the PowerPoint cognitive style in our schools. Rather than learning to write a report using sentences, children are being taught how to formulate client pitches and infomercials.” Edward Tufte has written seven books, including Visual Explanations, Envisioning Information, The Visual Display of Quantitative Information, and Data Analysis for Politics and Policy. He writes, designs, and self-publishes his books on information design, which have received more than 40 awards for content and design. He is Professor Emeritus at Yale University, where he taught courses in statistical evidence, information design, and interface design. 2003 The Cognitive Style of PowerPoint

5
emergent properties deep hierarchy simplisic thinking enforced linear
slide headings bullet points simplisic thinking hierarchy – used to manage complexity where is the overview? The core ideas of teaching - explanation, reasoning, finding things out, questioning, content, evidence, credible authority not patronizing authoritarianism - are contrary to the hierarchical market-pitch approach. Bob Horne (Stanford) bulleted lists – hard to show causal relationships Simplistic thinking, from ideas being squashed into bulleted lists, and stories with beginning, middle, and end being turned into a collection of disparate, loosely disguised points. This may present a kind of image of objectivity and neutrality that people associate with science, technology, and "bullet points". enforced linear sequence
 bulleted lists – hard to show causal relationships. Simplistic thinking, from ideas being squashed into bulleted lists, and stories with beginning, middle, and end being turned into a collection of disparate, loosely disguised points. This may present a kind of image of objectivity and neutrality that people associate with science, technology, and bullet points . enforced. linear. sequence.")
6
and also… too many slides bad slide design unreadable text
a crutch for presenters instead of a scaffold for learners a crutch for presenters instead of a scaffold for learners too many slides bad slide design unreadable text poor use of colour plain text only distracting effects a seductive technology that encourages style over content

7
Why use PowerPoint? Provide structure Emphasise key points
Show visual information Integrate multimedia Look professional Assist delivery Create handouts rrrrrrrrr

8
How many slides? One slide = two minutes Plus Title and End slide
Too many slides = ?

9
Too much text! One slide = two minutes talking
this is a guideline, not a rule – but having 20 slides for a 20 minute talk: increases the risk that your ‘talk’ is reduced to you reading out a list of bullet points increases the risk that you talk too long about the earlier slides and run out of time increases the risk that you have to skip over some slides to reach your conclusions

10
Keep it simple Six points per slide Six words per point
Don’t overload slides use more, simple slides

11
Keep it readable Font size = 28 points Use easy-to-read fonts:
24 points is OK 18 point is too small Use easy-to-read fonts: Serif fonts like Palatino or Georgia Sans Serif fonts like Arial or Verdana Cursive fonts like Comic Sans

12
Keep it clear Use high-contrast colours
mid-tones do not show up well avoid bright red colour-blind people confuse red and green Use colour or bold or italic for emphasis CAPITALS and underline are hard to read

13
Black on white Very high contrast Visual stress
Glare with data projectors

14
Off-white background Reduces contrast Reduces glare
Gradients look good

15
White on blue Classic choice Minimal glare Yellow text also good

16
Be consistent Backgrounds Fonts Colours Transitions Less is More

17
6% of the world health expenditure
Use strong images You don’t need to be an artist to create simple graphics – this is just circles and rectangles 75% of the world’s people 6% of the world health expenditure

18
Use photographs Make sure they are relevant to your talk and are not simply decoration This sculpture on the Highfield campus is Two Figures by Barbara Hepworth (Bronze, 1968)
")
19
Show trends, not data This chart was imported from Excel.
It needed some editing to make the text large enough to read

Similar presentations