Download presentation
Presentation is loading. Please wait.

1
Graphing in Science Class

3
Why do we use graphing? A useful tool in science
Makes data easier to interpret and make conclusions Visual characteristics of a graph make trends in data easy to see Helps us to "predict" data that is not measured on the graph.

4
Types of Graphs There are 3 different types of graphs: –Bar graphs
–Pie graphs –Line graphs Each type is used in different situations

5
Bar Graphs Used to show relationships between groups
The items being compared do not need to affect each other. Fast way to show big differences Easy to read

7
Circle or Pie Graph Used to show how a part of something relates to the whole Used to show percentages effectively

9
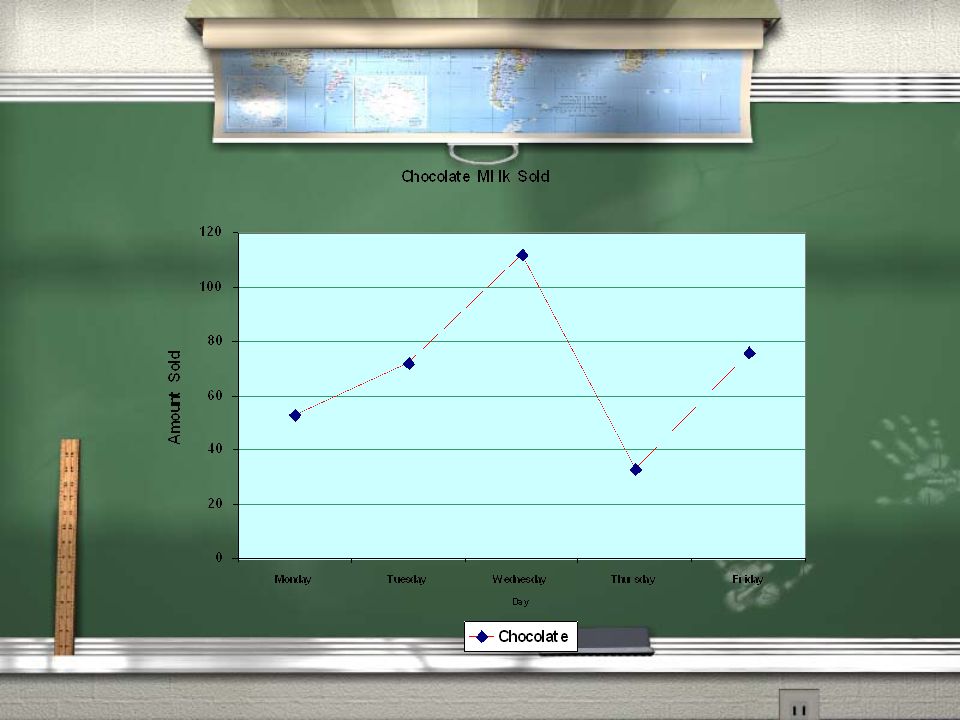
Line Graphs Used to show change over time.
Makes it clear to see trends by the rises and falls of the line graph

11
Graphing Steps Decide what type of graph to use Identify the variables
Determine the range Determine the scale Number and label each axis Plot the points Draw the graph Give your graph a title

12
Choosing the Right Graph
Bar graph if you are not looking for trends over time and the categories are not parts of a whole Pie chart if you need to compare different parts of a whole, time is not a factor and there are not too many categories Line graph if you need to see how a quantity changes over time

13
Identify the Variables
Independent Variable Experimenter manipulated (the thing you changed) x axis (horizontal) Dependent Variable Depends on the independent variable (how did the independent variable change it?) y axis (vertical)
 x axis (horizontal) Dependent Variable. Depends on the independent variable (how did the independent variable change it ) y axis (vertical)")
14
Determine Range and Scale
Subtract lowest value from the highest value - this is your range Create a scale that best fits your data - spread out your graph as much as possible to make your graph more readable

15
Number and Label Each Axis
Number the axes keeping in mind your range Label each axis so that anyone reading your graph can understand what the graph means Include units of measure

16
Plotting Plot each data value on the graph with a dot.
You can put the data number by the dot if it does not clutter your graph.

17
Drawing In some cases, you will connect the data points with a straight line A “Best Fit Line” is a curved or straight line that best fits the data points. Most graphs of experimental data are drawn as Best Fit Lines Allows us to Interpolate Allows us to Extrapolate

18
Interpolation Interpolate: predicting data between two measured points on the graph.

19
Extrapolation Extrapolate: extending the graph, along the same slope, above or below measured data.

20
Title Your title should clearly tell what the graph is about
If your graph has more than one set of data, provide a "key" to identify the different lines

Similar presentations


 The Independent Variable. A change in this variable affects the y variable. >")


.>")


