Download presentation
Presentation is loading. Please wait.

1
Salt Creek School District 48 Annual ISBE School Report Card Board of Education Report October 30, 2012

2
Parameters for School Report Card Required to be presented publicly and posted on the School District 48 website by November 1 of each year- the Report Cards contain student assessment information (ISATs) and other information about the school district The ISAT assessments are Illinois’ way of assessing schools’ progress toward the NCLB target proficiencies ISATs are one of our feedback tools along with MAP, AimsWeb and student classroom performance that we use to make adjustments in curriculum, instruction, and interventions for students that need them.
 and other information about the school district The ISAT assessments are Illinois’ way of assessing schools’ progress toward the NCLB target proficiencies ISATs are one of our feedback tools along with MAP, AimsWeb and student classroom performance that we use to make adjustments in curriculum, instruction, and interventions for students that need them.")
3
Salt Creek School District 48 Teaching Tomorrow’s Leaders Our Mission Statement “Salt Creek School District 48 will instill in all children a life-long desire to maximize their potential in a global society.”

4
Salt Creek School District 48 Our Vision: Our Students Will Become: Effective Communicators World Citizens Explorers of Their World Successful Thinkers Life-Long Learners

5
Factors for Excellent Schools (Robert Marzano) A Guaranteed and Viable Curriculum Challenging Goals and Effective Feedback Parent and Community Involvement Safe and Orderly Environment Collegiality and Professionalism
 A Guaranteed and Viable Curriculum Challenging Goals and Effective Feedback Parent and Community Involvement Safe and Orderly Environment Collegiality and Professionalism")
6
5 Essentials for School Success (University of Chicago) Schools that have these 5 factors are 10 times more likely to improve: - Ambitious Instruction - Effective Leaders - Collaborative Teachers - Supportive Environment - Involved Families
 Schools that have these 5 factors are 10 times more likely to improve: - Ambitious Instruction - Effective Leaders - Collaborative Teachers - Supportive Environment - Involved Families")
7
Who We Are Our Students and Instructional Setting

15
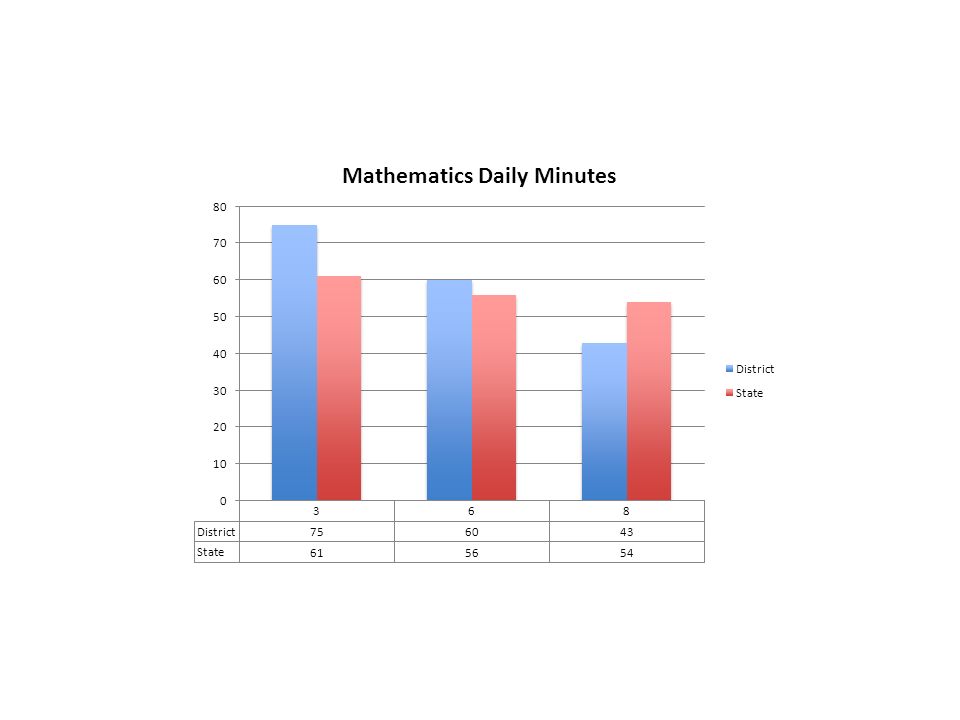
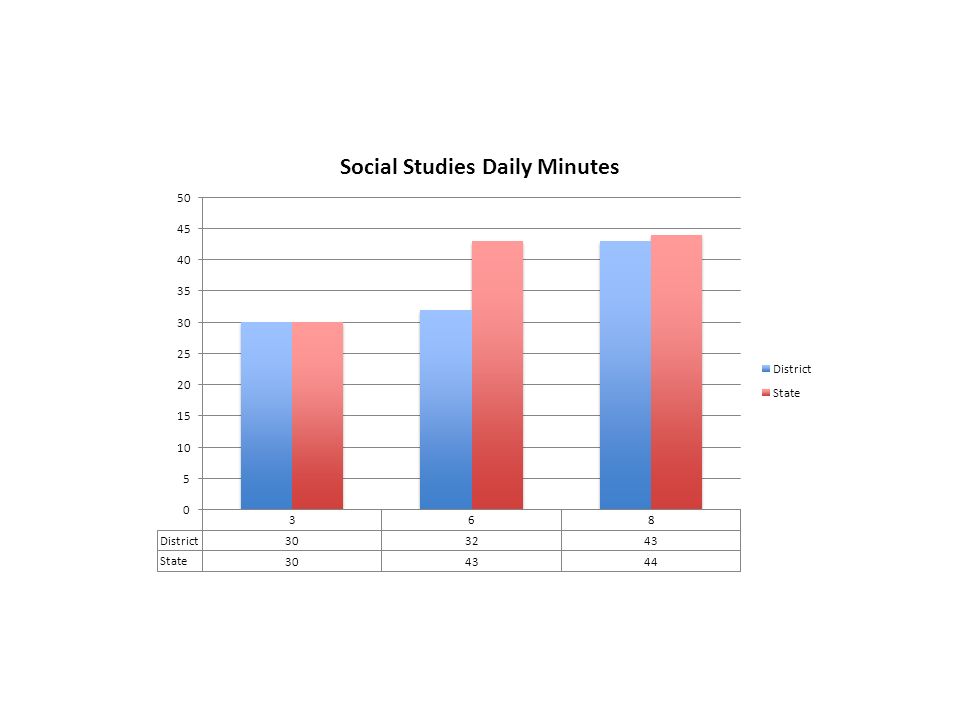
Instructional Organization Minutes of Daily Instruction in Core Academic Subjects

20
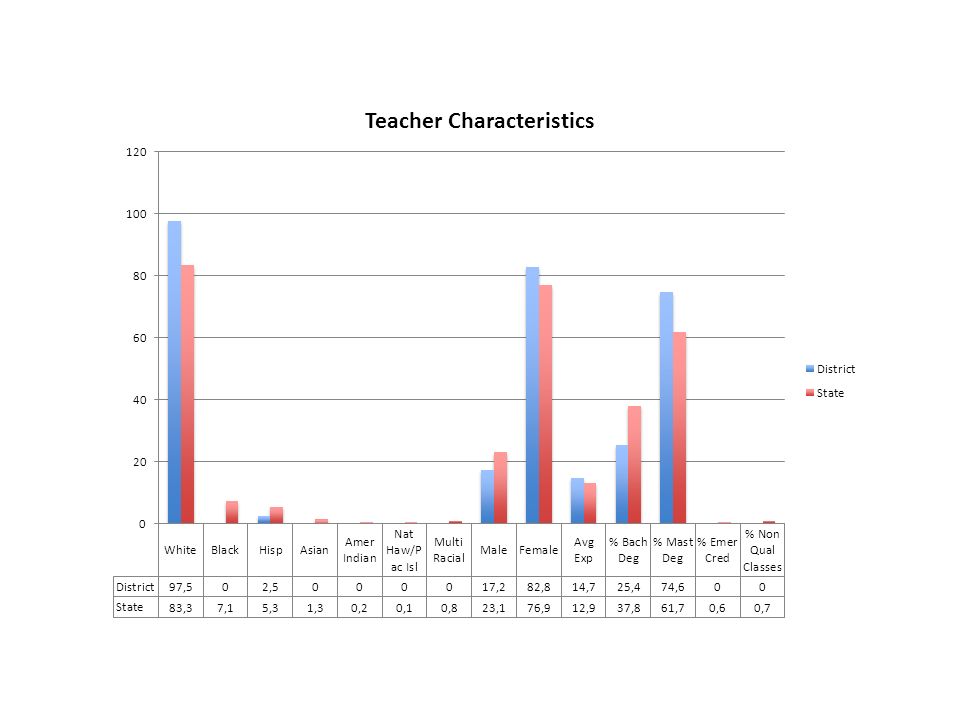
Salt Creek School District 48 Teacher Characteristics

22
Student Performance In Salt Creek School District 48, every student makes up about 2 percent of tested students at that grade level

23
Because of our Small Size It does not take many students scoring higher or lower than expected in any one year to make a difference-so, Beware of fluctuations-they may be a result of one or two students scoring differently that year!! Looking for trends over time is more important than focusing on small fluctuations from one year to another year

24
AYP Thresholds for Meeting/Exceeding Standards 200340%201077.5% 200440%201185% 200547.5%201285%* 200647.5%201392.5% 200755%2014100% 200862.5% 200970% *State waiver for 2012

25
Subgroups* that Impact Building and District AYP WhiteDisabled (IEP) BlackLow Income Asian American Indian Multi Racial/Ethnic Limited English Proficient (ELL) *Groups with 45 or more students
 BlackLow Income Asian American Indian Multi Racial/Ethnic Limited English Proficient (ELL) *Groups with 45 or more students")
26
ISAT Subject Areas Tested 2012 3 rd GradeReading, Math 4 th GradeReading, Math, Science 5 th GradeReading, Math 6 th GradeReading, Math 7 th GradeReading, Math, Science 8 th GradeReading, Math

27
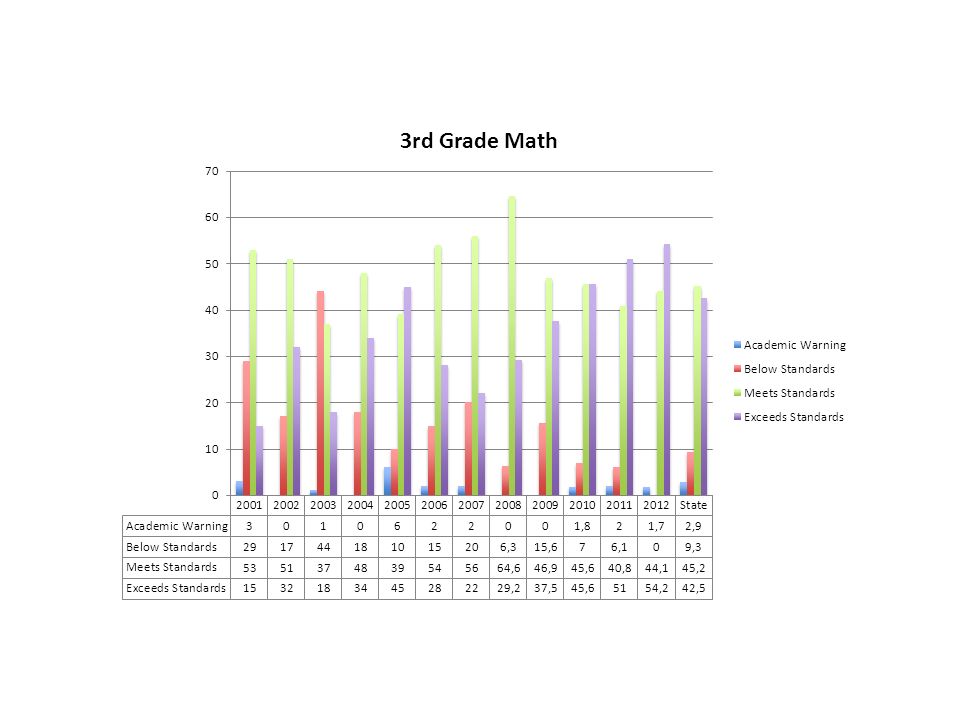
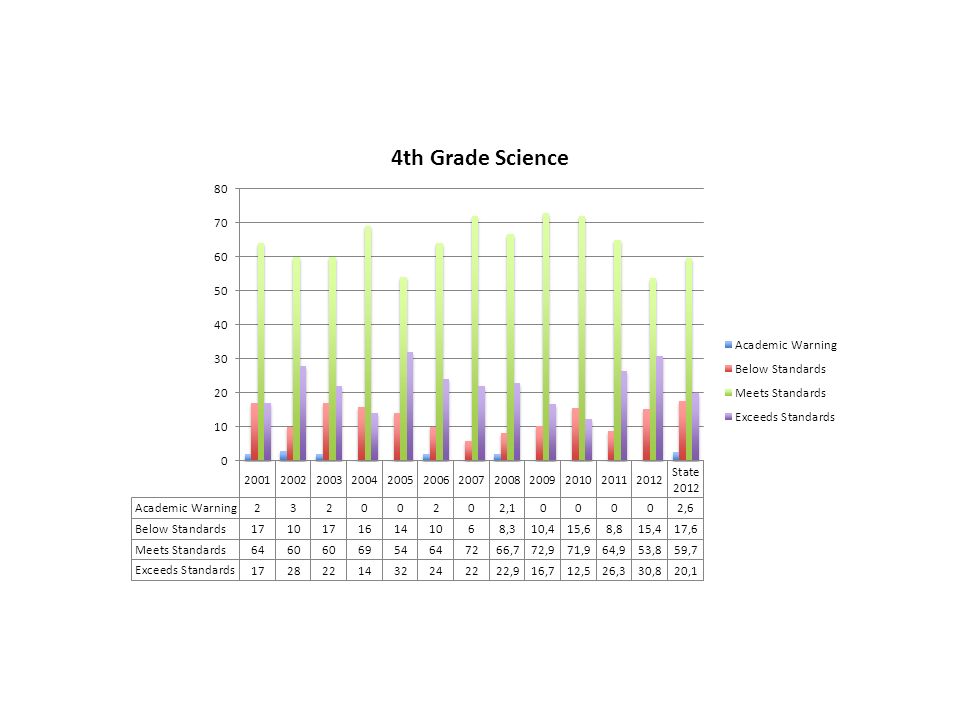
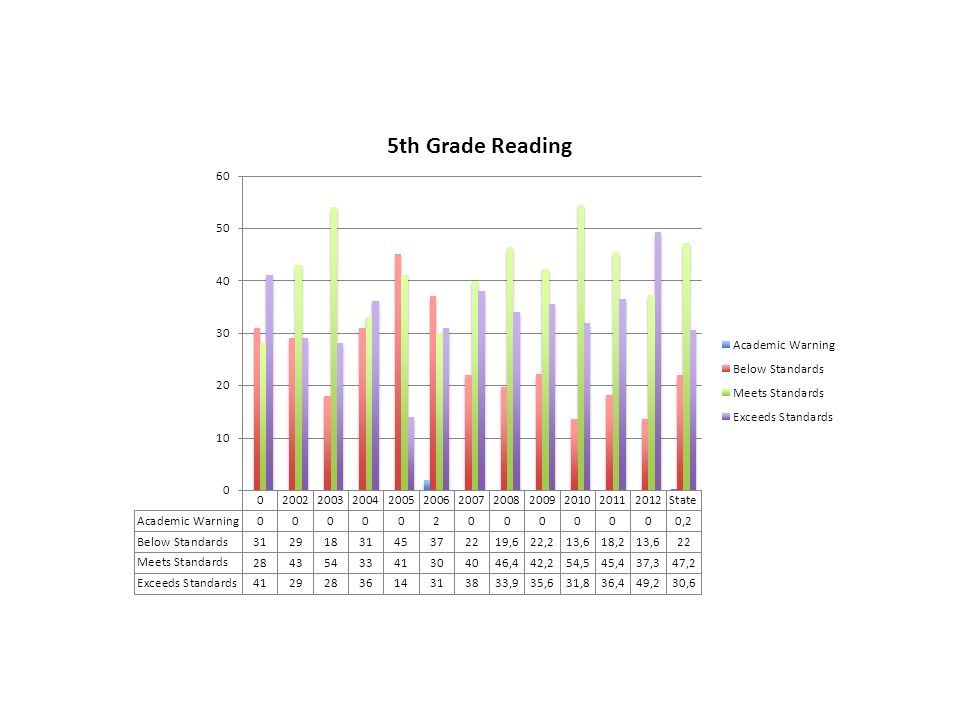
ISAT Performance Levels Academic Warning: Limited knowledge and skills Below Standards:Basic knowledge and skills, but gaps are apparent Meets Standards: Effective and proficient knowledge and skills Exceeds Standards: Advanced knowledge and skills with extended and creative applications

28
2012 ISAT Performance Stella May Swartz School 3 rd and 4 th Grades

34
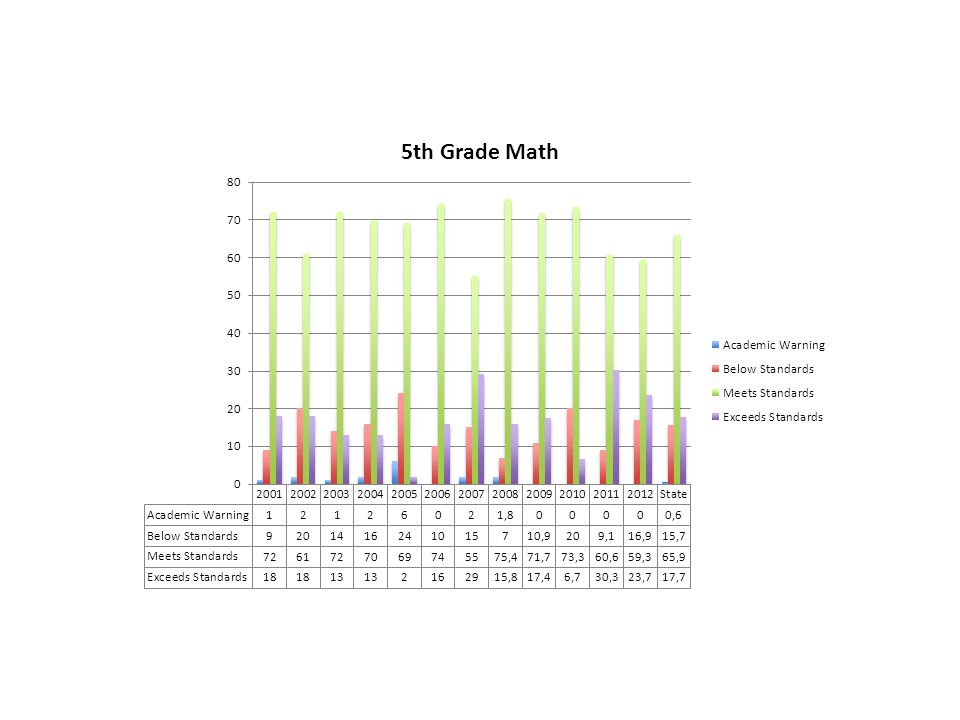
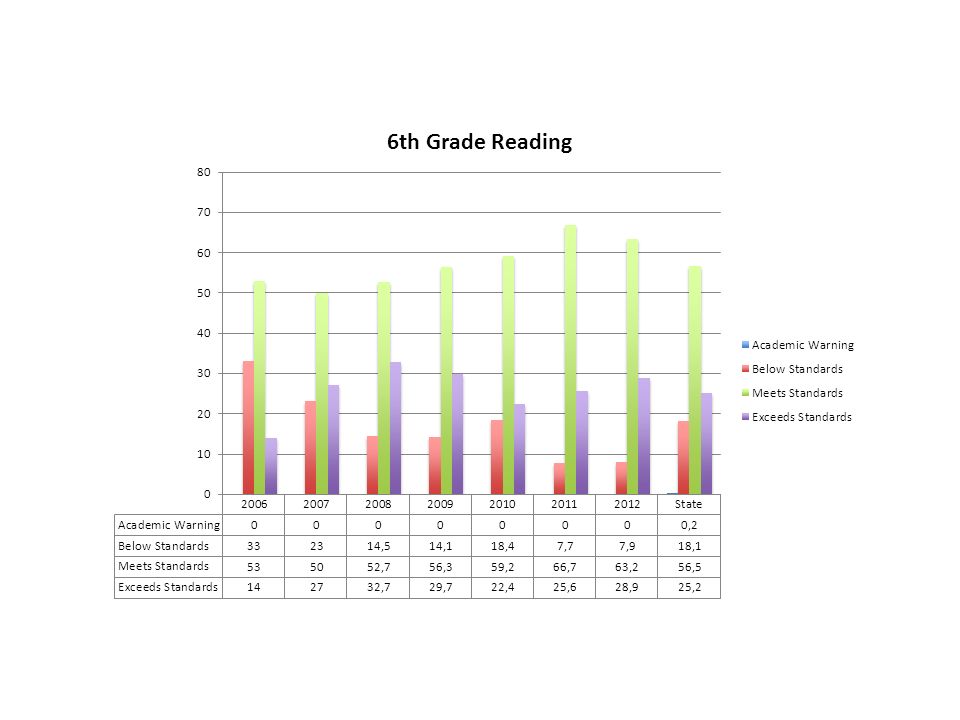
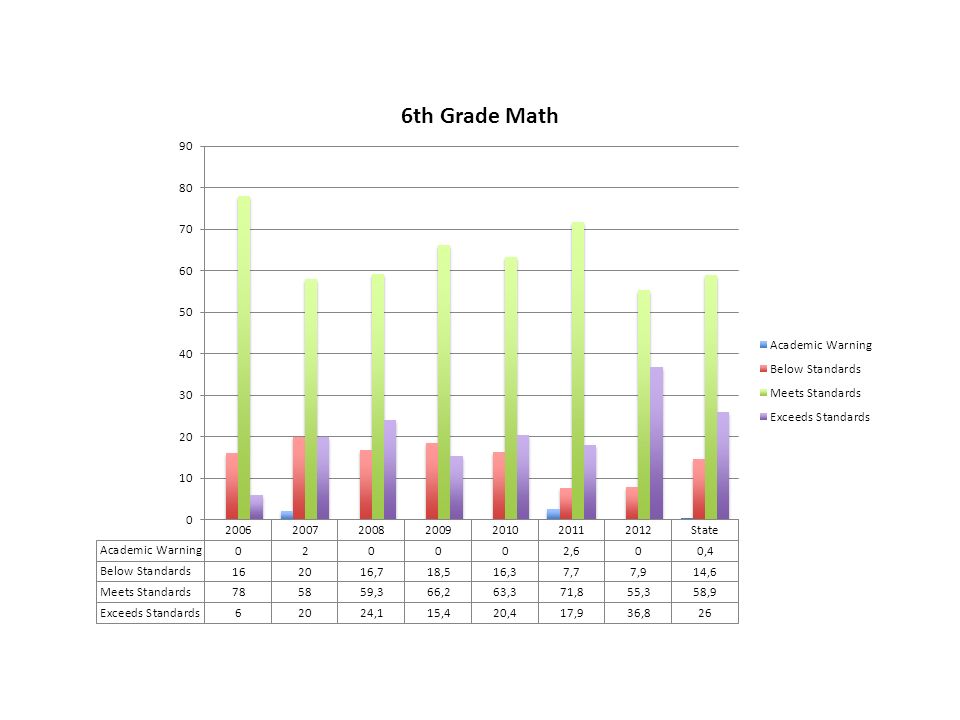
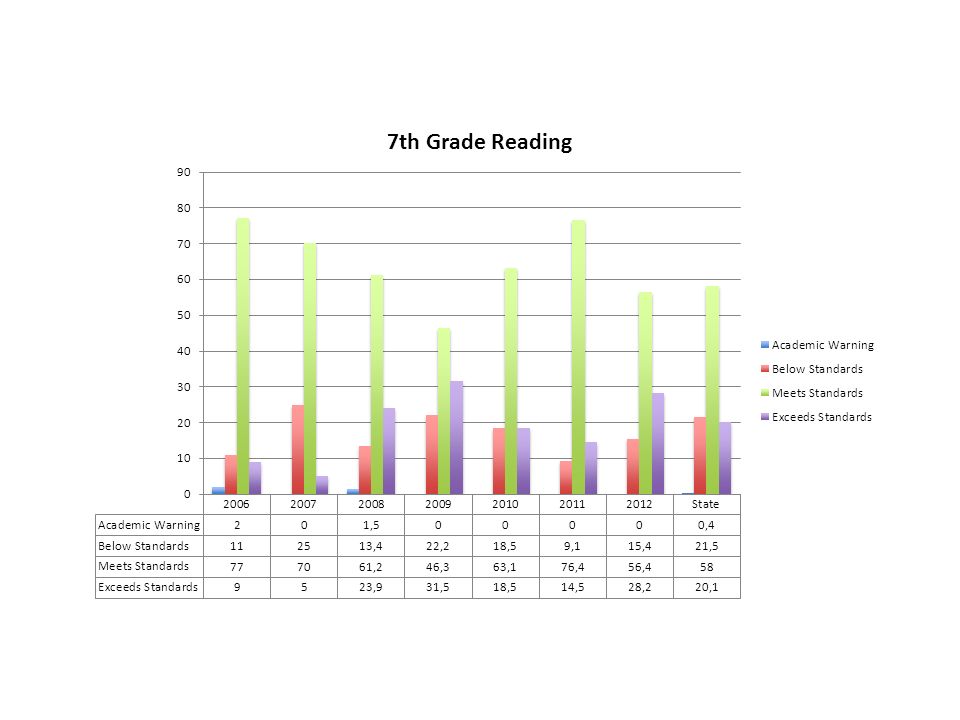
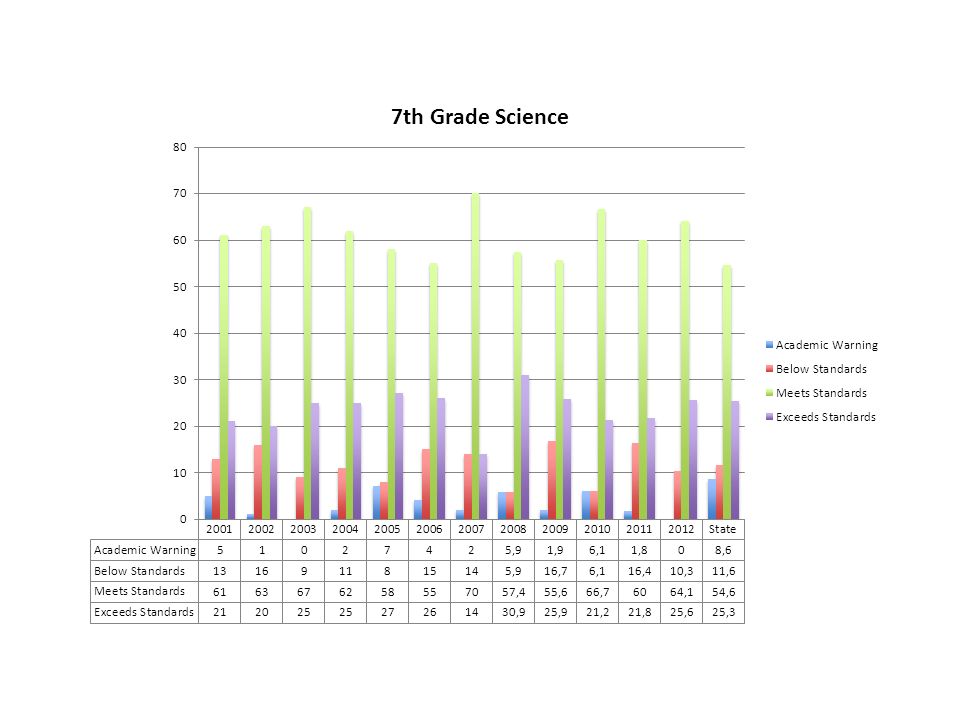
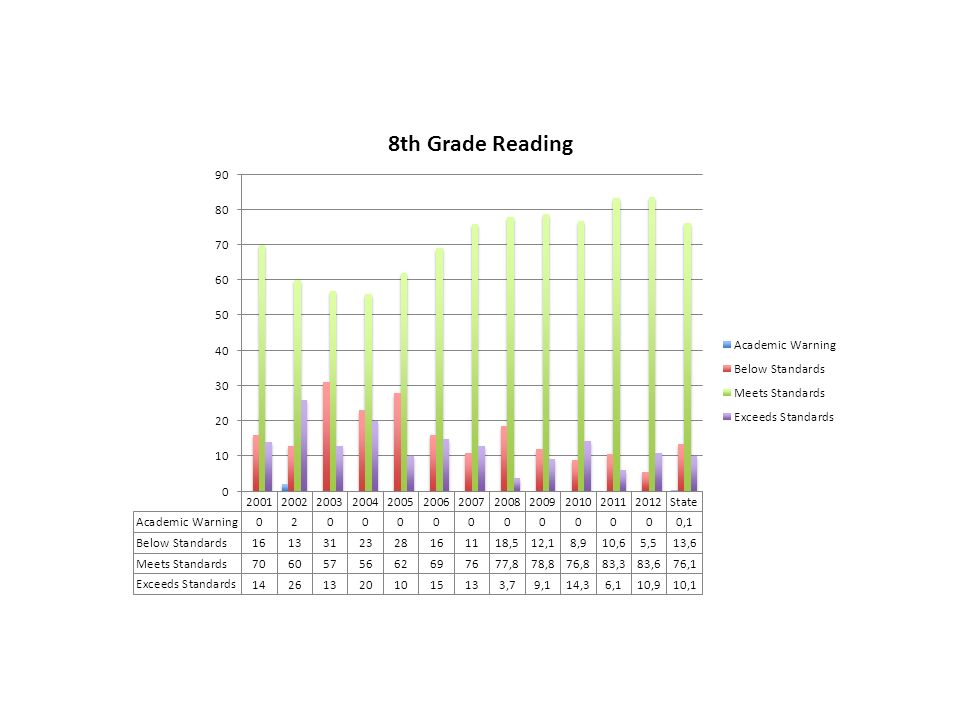
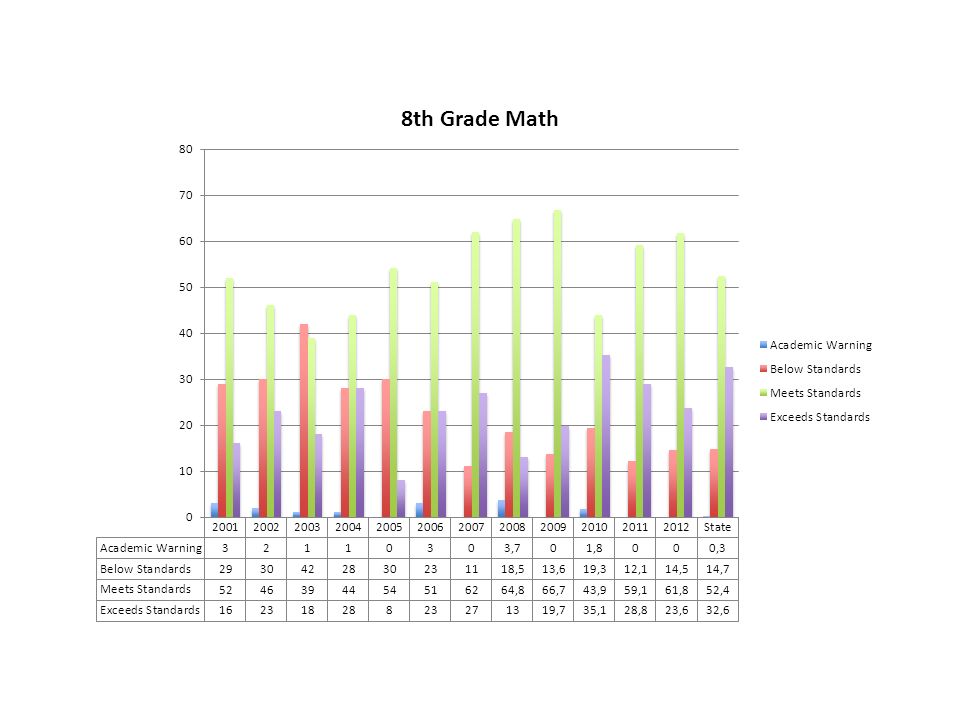
2012 ISAT Performance Albright Middle School 5 th, 6 th, 7 th, and 8 th Grades

45
Summary and Conclusions

46
Overall ISAT Conceptual Summary- Grade Level/Subject View 88.6 percent of District 48 students overall met or exceeded state standards 14 Subjects/Grade Levels Assessed -10 we feel very good about -4 are good, but we need more in the Exceeds Standards category -Our goal is to increase Exceeds and eliminate Below Standards and Academic Warning

47
District and School ISAT Summaries- School and Subgroup Review District 48 meets AYP standards in Reading, Math, and Science overall, with 88.6% meeting or exceeding standards. This is our highest percent Meeting or Exceeding standards. We have moved from merely expecting students to meet standards to really focusing on students exceeding standards. This will help us transition into the more rigorous expectations that we will be facing under the Common Core curriculum assessments in Reading and Math. In the fourteen grade level/subject area assessments taken in 2012, we increased the percent in the Exceed level in ten.

48
Focus on Growth As all know, we have begun using and analyzing the student growth (propensity) information on our MAPs assessment from our work with ECRA. To date, these analyses show us making “Typical” (as expected) growth overall- although there is some variance in the grade level/subject area reviews. Our District Leadership Team (DLT) is reviewing this information.
 growth overall- although there is some variance in the grade level/subject area reviews. Our District Leadership Team (DLT) is reviewing this information..")
49
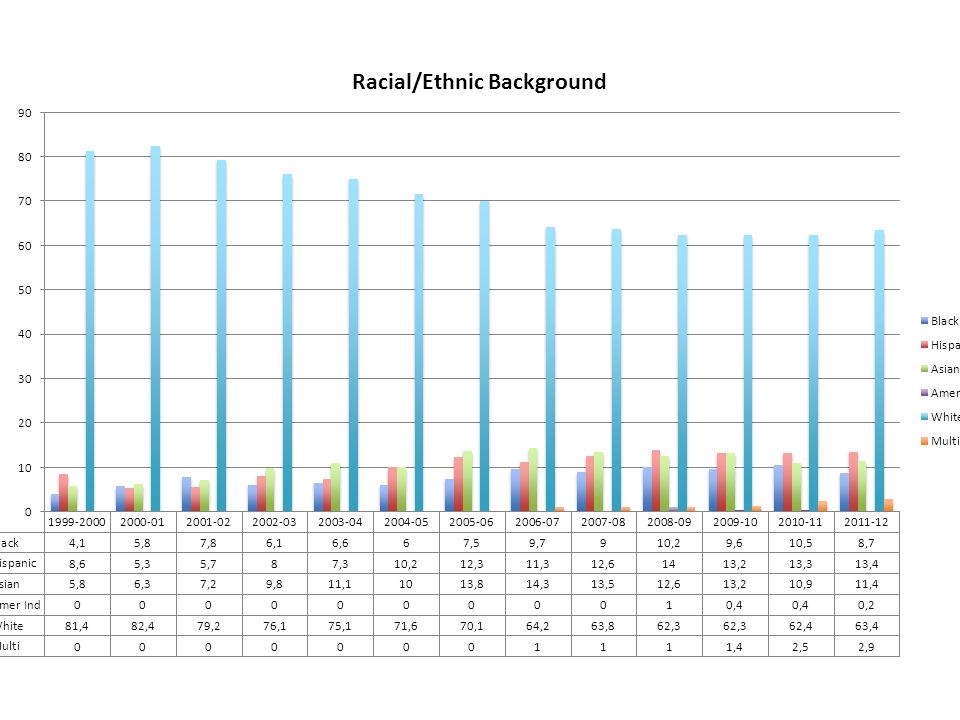
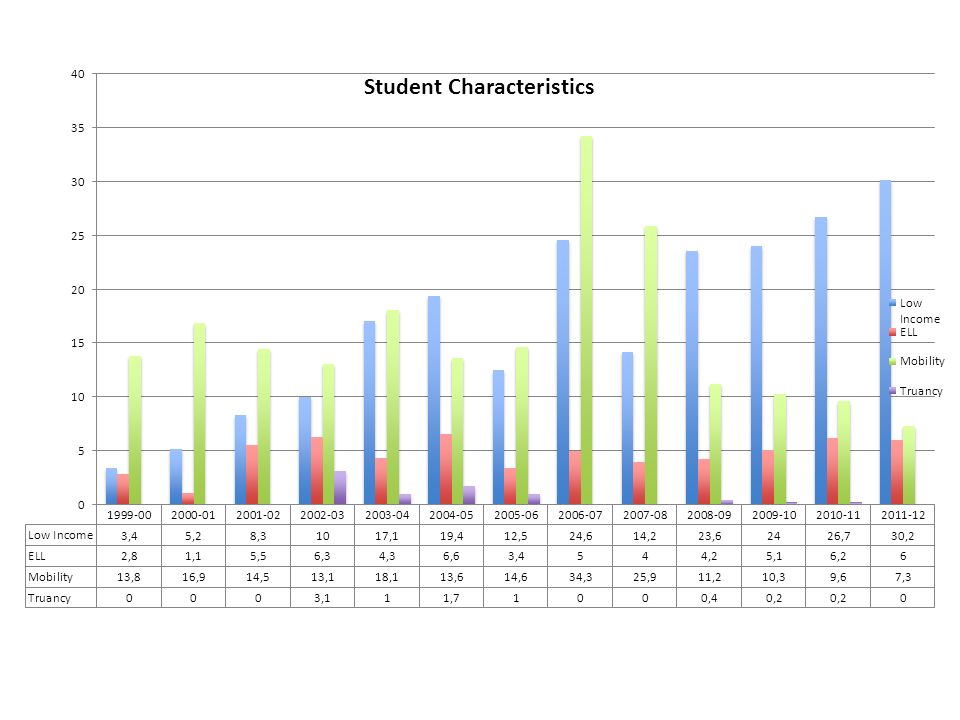
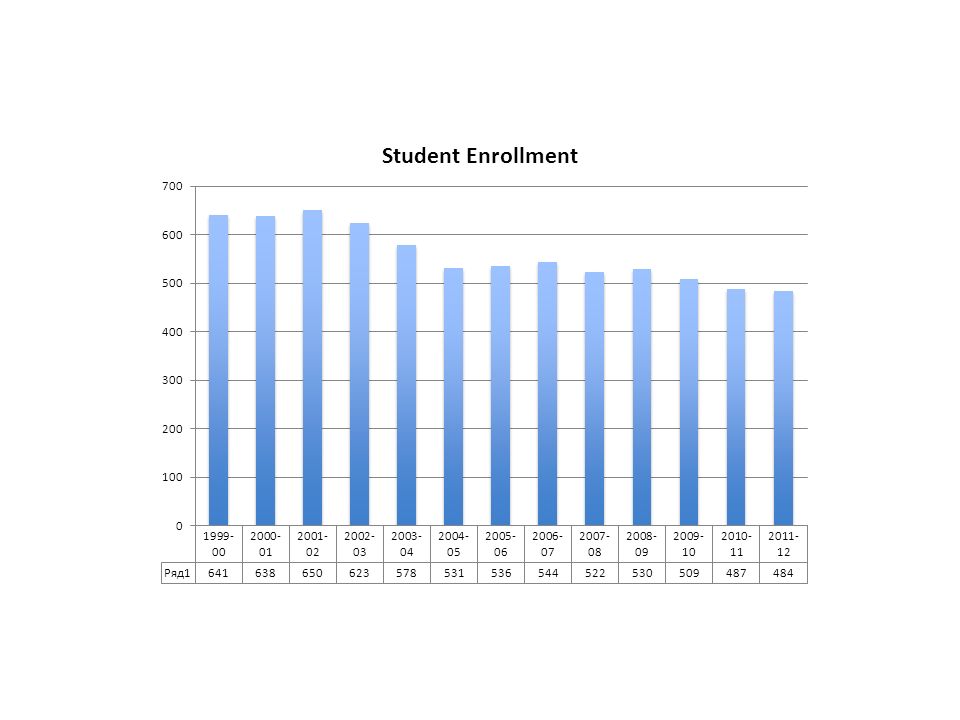
2012 Overall Report Card Summaries and Themes District 48 continues to be culturally diverse, with 36 percent of our student population being non-white 7 percent of our student population is mobile, while 30 percent are low income Our enrollment at the time of this report was 484 students, very similar to last year.

50
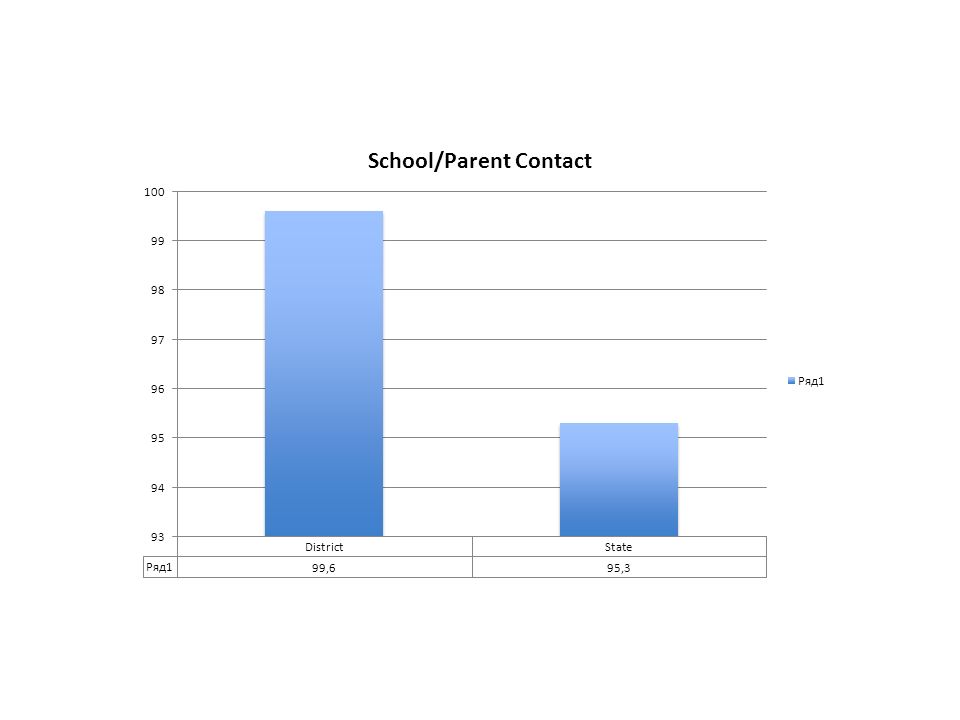
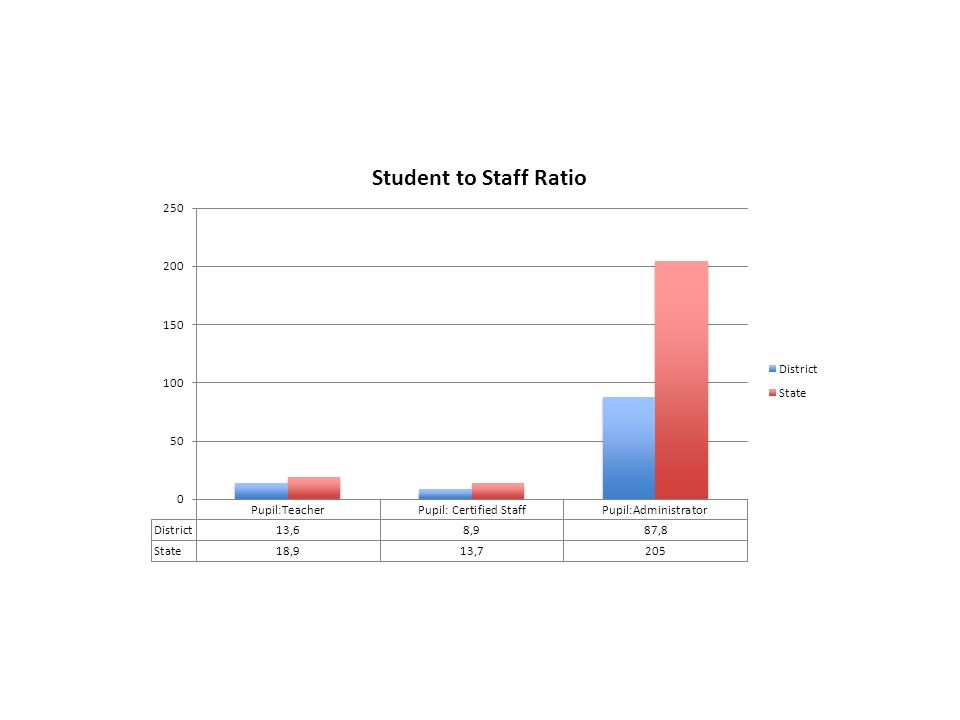
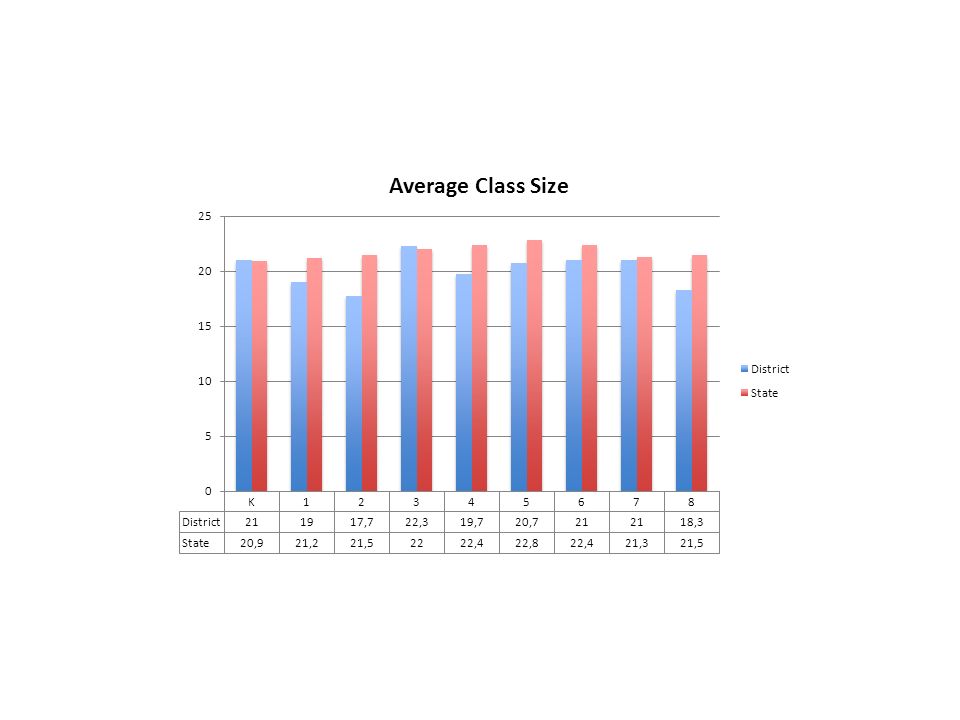
2012 Overall Report Card Summary and Themes (continued) Our students have great attendance, and we have excellent contact with our parents We have very good staff to student ratios and good class size averages Our instructional minutes in the core subjects are close to state averages; we have extra reading help at all three schools for students who need it.
 Our students have great attendance, and we have excellent contact with our parents We have very good staff to student ratios and good class size averages Our instructional minutes in the core subjects are close to state averages; we have extra reading help at all three schools for students who need it.")
51
2012 Overall Report Card Summary and Themes Our teachers are well trained- over 74 percent have Master’s degrees- we have a number taking advantages of our Master’s tuition reimbursement program Our teachers have an average of almost 15 years of teaching experience

52
Goals Based on 2012 ISAT Data We continue to need to increase the number of students meeting and exceeding standards as we work to make sure we are ready for the more rigorous analyses that will be coming forth with the Common Core Expectations (2014). Review of our MAPS/AimsWeb data with the ECRA propensity considerations will give us a more precise analysis of where we need to improve.

53
Goals Based on the 2012 ISAT Data We also need to use our internal Individual RTI Problem Solving (IPS) process to give us information needed to address specific students needs and get them help. We need to work with our CLT to continue to advance and refine our curriculum We need to continue to focus on excellence in instruction, and continue to train our teachers in the latest scientifically validated teaching methods.

54
Goals Based on 2012 ISAT Data We need to use our Professional Learning Visit model to give each other feedback about the use of specific practices (e.g. Academic Vocabulary, Instructional Technology) in our classrooms.
 in our classrooms..")
55
Final Thoughts About Improvement of Student Learning! Hire excellent teachers (“Get the Right People on the Bus”) Promote excellence in classroom instruction with training in scientifically based instructional models High expectations for all of us Use learning feedback to modify the curriculum as needed
 Promote excellence in classroom instruction with training in scientifically based instructional models High expectations for all of us Use learning feedback to modify the curriculum as needed.")
56
Final Thoughts About Improvement of Student Learning! Use learning feedback to give teams information about specific students that leads to interventions that they need Continue to reinforce our Professional Learning Culture.

Similar presentations


. m7oU.>")

.>")


>")

 UPDATE October 29, 2013.>")


 Objectives & Actions.>")
 HSTW/MMGW Site Presentation ( Month Date, 2006) Promising Practices Next Steps Major Challenges Technical Review Visit (TRV)>")

