Download presentation
Presentation is loading. Please wait.

1
Economics of GHG Management in the LULUCF sector Michael Obersteiner JRC Improving the Quality of Community GHG Inventory… 22-23 rd Sept. 2005

2
INSEA-toolbox Land Use/cover Soil DB, Management Ancillary Cost / Technology data Non C-GHGs Biomass crops Sequestered carbon 2030 2000 2050 Climate Change Geography of Production Possibilities Link to Energy Models Food Crops / Wood Agricultural forest Market Model

3
Common Platform

4
National Economic Models FASOM Regional Farm Type Model AROPAj Farm Model EFEM-DNDC Stand level Model PICUS Regional Forest Model EURO - FOR Model for GHG Response to Management EPIC Common Database and Standards Common Database and Data Structure Harmonized System Boundaries IPCC GPG and /or FGA Accounting Consistent Baseline Assumptions Joint Catalogue of GHG Mitigation Measures Uniform Validation Criteria Agreed Sustainability Constraints Common IT Standards Standard Scenario Assumptions and Story Lines Joint Vision INTEGRATED POLICY FRAMEWORK All Partners

5
National Economic Models AGRIPOL FASOM Regional Farm Type Model AROPAj Farm Model EFEM-DNDC Stand level Model PICUS Regional Forest Model EURO - FOR Model for GHG Response to Management EPIC Common Database and Standards Common Database and Data Structure Harmonized System Boundaries IPCC GPG and /or FGA Accounting Consistent Baseline Assumptions Joint Catalogue of GHG Mitigation Measures Uniform Validation Criteria Agreed Sustainability Constraints Common IT Standards Standard Scenario Assumptions and Story Lines Joint Vision INTEGRATED POLICY FRAMEWORK

6
EPIC simulates many Processes: on a daily time step Weather: simulated or actual Hydrology: evapotranspiration, runoff, percolation, 5 PET equations,... Erosion: wind and water, 7 erosion equations Carbon sequestration: plant residue, manure, leaching, sediment,... Crop growth: NPK uptake, stresses, yields, N-fixation,... Fertilization: application, runoff, leaching, mineralisation, denitrification, volatilization, nitrification,... Tillage: mixing, harvest efficiencies,... Irrigation and furrow diking,... Drainage: depth,... Pesticide: application, movement, degradation,... Grazing: trampling, efficiency,... Manure application and transport,... Crop rotations: inter-cropping, weed competition, annual and perennial crops, trees,...

7
EPIC/APEX Input data - Management Crop rotation (crops, grass/legumes, trees) date of planting date & amount of fertilization (kg/ha) date & amount of irrigation (mm) date & amount of pesticides (kg/ha of active ingredients) date of tillage operation (plough, harrow spike, field cultivator, thinning,...) date of harvesting (expected yield), grazing,...
 date of planting date & amount of fertilization (kg/ha) date & amount of irrigation (mm) date & amount of pesticides (kg/ha of active ingredients) date of tillage operation (plough, harrow spike, field cultivator, thinning,...) date of harvesting (expected yield), grazing,...")
8
Yield Validation

9
Erosion Conventional / Reduced Tillage

10
Soil Organic Carbon Conventional / Reduced Tillage

11
SOC

12
National Economic Models AGRIPOL FASOM Regional Farm Type Model AROPAj Farm Model EFEM-DNDC Stand level Model PICUS Regional Forest Model EURO - FOR Model for GHG Response to Management EPIC Common Database and Standards Common Database and Data Structure Harmonized System Boundaries IPCC GPG and /or FGA Accounting Consistent Baseline Assumptions Joint Catalogue of GHG Mitigation Measures Uniform Validation Criteria Agreed Sustainability Constraints Common IT Standards Standard Scenario Assumptions and Story Lines Joint Vision INTEGRATED POLICY FRAMEWORK

13
Emission trajectorium - Agriculture

14
Animal numbers Crop area Pasture/ Forage Purchased Feed On-farm consumption EmissionsRHS Constraints CNC CH4N2O Objective ++++---t CH4 Enteric fermentation emissions Cattle ++++++-1/23 =0 Non-Cattle ++++++-1/23 =0 CH4 Manure-management emissions Cattle ++++++-1/23 =0 Non-Cattle ++++++-1/23 =0 CH4 rice production ++-1/23 =0 N2O Manure management emissions ++-1/296 =0 N2O Agr soils direct emissions ++++-1/296 =0 N2O Agr soils indirect emissions ++++-1/296 =0 N2O Agr soils animal production ++-1/296 =0 Emission accounting: Overview Emissions factors GWPs Tax (/tCO2)
")
15
Constraints Animal numbers Crop area Pasture /Forage Purchased Feed On-farm consumption EmissionsRHS CNC CH4N2O Objective ++++---- Feed requirements Energy ++------ <=0 Protein ++------ <=0 Maximum ingested matter (cattle) +------ =>0 Demography (cattle)+/- =0 CH4 Enteric fermentation emissions ++++++- =0 CH4 Manure management emissions ++++++- =0 N2O Manure management emissions ++- =0 N2O Agr soils emissions ++++- =0 Animal feeding : current modelling approach (contd) Needs Energy and protein contents of feed CapacityTotal matter in feed
 =>0 Demography (cattle)+/- =0 CH4 Enteric fermentation emissions =0 CH4 Manure management emissions =0 N2O Manure management emissions ++- =0 N2O Agr soils emissions =0 Animal feeding : current modelling approach (contd) Needs Energy and protein contents of feed CapacityTotal matter in feed")
16
Animal numbers Crop area Pasture /Forage Fores t area Purchased Feed On-farm consumption EmissionsRHS Constraints CNC CCH4N2O Objective +++++--+t-t Carbon sequestration +-12/44 =0 CH4 Ent fermentation emissions Cattle ++++++-1/23 =0 Non-Cattle ++++++-1/23 =0 CH4 Man-manag emissions Cattle ++++++-1/23 =0 Non-Cattle ++++++-1/23 =0 CH4 rice production ++-1/23 =0 N2O Man man emissions ++-1/296 =0 N2O Agr soils dir emissions ++++?-1/296 =0 N2O Agr soils indir emissions ++++?-1/296 =0 N2O Agr soils anim production ++-1/296 =0 Emission accounting: including forestry activities Premium (/tCO2) Sequestration rate (tC/ha/yr) NPV (/ha/yr)
 Sequestration rate (tC/ha/yr) NPV (/ha/yr)")
17
EU-15 agricultural abatement supply -8% / 2001 (-15% /1990) 55 EUR/tCO2eq
 55 EUR/tCO2eq")
18
Infra-regional downscaling (e.g. Baden-Württemberg)
")
19
INRA/UHOH comparison: Baseline emissions by sources Common emission coverage UHOH: 5092 ktCO2eq INRA: 5115 ktCO2eq

20
INRA estimates of marginal abatement costs BW Germany EU-15

21
Cost are different for different farmers…..

22
National Economic Models AGRIPOL FASOM Regional Farm Type Model AROPAj Farm Model EFEM-DNDC Stand level Model PICUS Regional Forest Model EURO - FOR Model for GHG Response to Management EPIC Common Database and Standards Common Database and Data Structure Harmonized System Boundaries IPCC GPG and /or FGA Accounting Consistent Baseline Assumptions Joint Catalogue of GHG Mitigation Measures Uniform Validation Criteria Agreed Sustainability Constraints Common IT Standards Standard Scenario Assumptions and Story Lines Joint Vision INTEGRATED POLICY FRAMEWORK

23
PICUS 2.0

24
Forestry modeling framework Forestry output: C storage (soil, biomass) Wood Energy biom. Forested area Alternatives: C storage Wood Energy biom. management scenarios: (harvest, thinning, species) potential NPP Initial state forest and soil climate FASOM model -economic optimization of land use OSKAR model -forestry scenarios NPP model management costs prices alternative land uses
 potential NPP Initial state forest and soil climate FASOM model -economic optimization of land use OSKAR model -forestry scenarios NPP model management costs prices alternative land uses.")
25
OSKAR model output for a HRU areasize (m 2 ) BiomassManagement scenario and predicted production (wood, carbon storage, energy) 1A1A1 B1B1 m1 p1m2 p3m3 p3m4 p4... 2A1A1 B2B2 3......

26
Forest growth Density dependent growth

27
Density and stand development Thinning and Self-thinning Artificial and Natural regeneration Impact of Management of Soil carbon Regeneration and final Cutting Species Change Flexible Rotation Periods growth thinning self-thinning biomass soil carbon mortality decomposition CO 2 density stem biomass 20% 70% 0%

28
National Economic Models FASOM Regional Farm Type Model AROPAj Farm Model EFEM-DNDC Stand level Model PICUS Regional Forest Model EURO - FOR Model for GHG Response to Management EPIC Common Database and Standards Common Database and Data Structure Harmonized System Boundaries IPCC GPG and /or FGA Accounting Consistent Baseline Assumptions Joint Catalogue of GHG Mitigation Measures Uniform Validation Criteria Agreed Sustainability Constraints Common IT Standards Standard Scenario Assumptions and Story Lines Joint Vision INTEGRATED POLICY FRAMEWORK

29
Basic Modeling Processing Markets Feed Mixing Other Resources Grazing Labor Pasture Land Natl. Inputs Forestland Water Livestock Production Crop Production Export Domestic Demand Import Biofuel/GHG Demand Forest Production Cropland

30
Mitigation Strategy Equilibrium 0 100 200 300 400 500 020406080100120140160180200 Carbon price ($/tce) Emission reduction (mmtce) CH4 N2O Ag-Soil sequestration Afforestation Biofuel offsets
 Emission reduction (mmtce) CH4 N2O Ag-Soil sequestration Afforestation Biofuel offsets")
31
Land Use Change until 2100 for B1 Intensity map: (affected) ha x C-uptake Existing forest Afforestation Deforestation
 ha x C-uptake Existing forest Afforestation Deforestation")
32
Spatial Distribution of GDP Important inputs to the spatially explicit forestry and regional agricultural model Necessary information for vulnerability, adaptation and impact assessment

33
Carbon Sequestration Total Carbon Supply: B1/A2

34
Summary Detailed Biophysical Models –Yield Impacts –Environmental Impact Assessment Integrated from Farm – Global Agriculture/Forestry/Energy Model

35
Conclusion No free lunches after CP1 –transfer from Energy sector Trade-offs (Ammonia vs N2O, Minimum tillage vs. Pesticides, Carbon vs. Bioenergy) Heterogeneity in biophysical and economic responses. Catastrophic events (e.g. fire) Transaction costs Use economic instruments or very well planned traditional (supported by precise scientific tools)
 Heterogeneity in biophysical and economic responses. Catastrophic events (e.g. fire) Transaction costs Use economic instruments or very well planned traditional (supported by precise scientific tools).")
36
Carbon permit Electricity Pulp / paper Biomass Energy Market Policy Climate Policy Sector Policy / Technology Land use Policy

37
Modular Commitment Strategy CO 2 El BM \pi

38
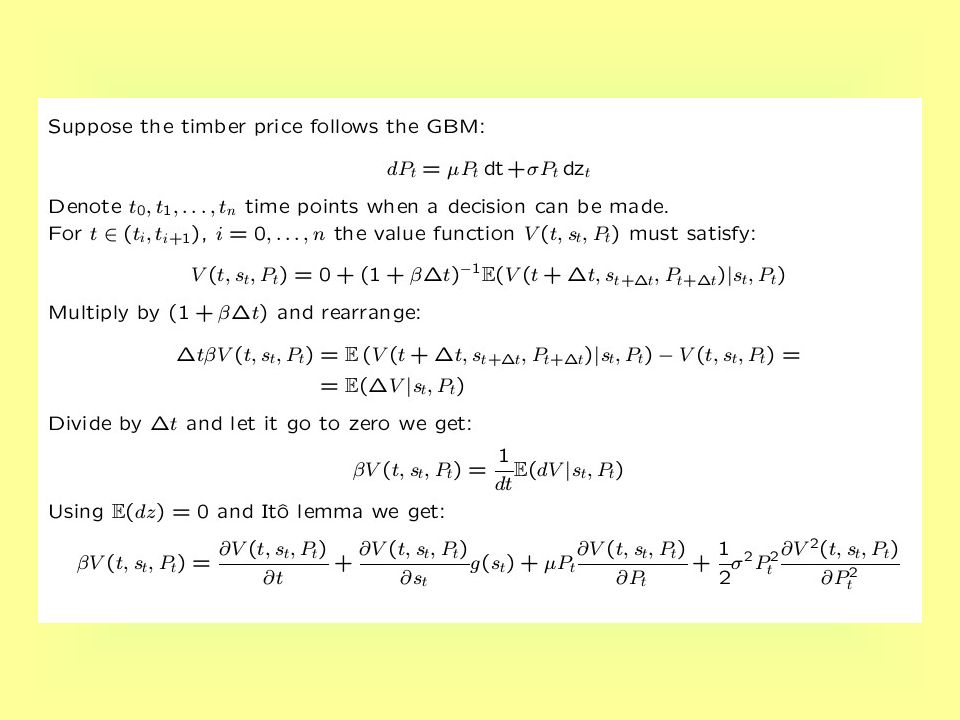
Model description Objective: Maximize the value of the forest Source: www.whrc.org/science/ neforest

40
Results Red – postpone decisionBlue - harvest

42
Results

43
Example with 5 biofuel plants CarsFuel (MW)Bio (ODT/year) 461500185521100 514300206580800 1E+064631307600 462300185522100 362800145409700
Bio (ODT/year) E")
44
Cost in /GJ MEOH

45
Cost in / l MEOH

46
Assessing abatement costs in LULUCF sector Can agriculture&forestry contribute to lower the costs of meeting the KP targets? ….beyond How much EU LULUCF abatement for a given carbon price? Regional and technological distribution of abatement potential? Link between GHG sector –Bioenergy supply –CAP –Soil thematic strategy, CAFE, Water directive….

47
Background The Kyoto Protocol requires that EU-15 reduces its GHG emissions by 8% / 1990 levels (time horizon 2008-12) Agriculture represents ~10% of EU GHG emissions –No commitment despite possible wellfare increases Agricultural and climate/env policies at a crossroad –Emission Trading Scheme (inclusion of agricultural emissions and sinks? – 23 EURO/tC) –CHP directive, Biomass Action Plan –Clean Air, Nitrate etc…directives, STS –CAP reform and cross-compliance
 –CHP directive, Biomass Action Plan –Clean Air, Nitrate etc…directives, STS –CAP reform and cross-compliance.")
48
…the Challenge ahead…. Identification of integrative, effective and efficient Policies –Competitiveness & New Markets –Rural Development –Environmental Performance Transition planning –Mechanism design –Timing –Precise Planning and Forecasting

49
Distribution of BARLEY_REST and MAIZETOT on arable land of Baden- Württemberg as a result of LUCAS Data Broker BARLEY_REST MAIZETOT

50
National Economic Models AGRIPOL FASOM Regional Farm Type Model AROPAj Farm Model EFEM-DNDC Stand level Model PICUS Regional Forest Model EURO - FOR Model for GHG Response to Management EPIC Common Database and Standards Common Database and Data Structure Harmonized System Boundaries IPCC GPG and /or FGA Accounting Consistent Baseline Assumptions Joint Catalogue of GHG Mitigation Measures Uniform Validation Criteria Agreed Sustainability Constraints Common IT Standards Standard Scenario Assumptions and Story Lines Joint Vision INTEGRATED POLICY FRAMEWORK

51
Farm-level model

Similar presentations


 Measuring the Environmental Benefits of Conservation Managing the Agricultural Landscape for Environmental.>")

>")


 CLA, Chapter 8 (Agriculture), WGIII Bonn, 12 May 2007.>")
 Integration of farm-level and forest plot-level models.>")


