Download presentation
Presentation is loading. Please wait.

1
2015 Learning Environments for ALL Summer Institute

2
For Institute information, session descriptions, session handouts, and session evaluations, visit: learningenvironmentsforalls2015.sched.org FYI

3
11:40 – 12:00 Personalizing the Curriculum for High School Students Ruth Anne Hodges & Rashell Bowerman Schedule addition:

4
#ALLSI15 Keep the conversation going on Twitter

5
Learning Environments for All Building a Coherent Infrastructure

7
I am dedicated to improving outcomes for kids

8
I have necessary support to effectively do my job

9
I am dedicated to improving outcomes for kids I have necessary support to effectively do my job The educational system, at all levels, is aligned and coordinated to support efforts to help kids

10
Third Grade Reading Proficiency https://www.mischooldata.org/ Group 2008- 2009 2013- 2014 Avg Change/yr Number of years to 85% All 58.961.3+0.4849.38 African American 38.337.3-0.2?? Hispanic of Any Race 41.846.9+1.0237.35 Economically Disadvantaged 44.447.9+0.753 English Learners 32.637.2+0.9251.96 Students with Disabilities 29.135.1+1.241.58

11
Third Grade Math Proficiency Group2008- 2009 2013- 2014 Avg Change/yr Number of years to 85% All 39.840.1+0.06748.3 African American 17.818.2+0.08835 Hispanic of Any Race 23.426.3+0.58101.21 Economically Disadvantaged 24.826.9+0.42138.3 English Learners 24.526.4+0.38154.2 Students with Disabilities 20.422.2+0.36174.4

12
Eleventh Grade Reading Proficiency Group 2008- 2009 2012- 2013 Avg Change/yr Number of years to 85% All 49.154.01.220.22 African American 23.129.01.533.58 Hispanic of Any Race 34401.237.5 Economically Disadvantaged 31.538.01.624.85 English Learners 11.413.00.4166.5 Students with Disabilities 15.519.00.968.71

13
Eleventh Grade Math Proficiency Group2008- 2009 2013- 2014 Avg Change/yr Number of years to 85% All 25.7290.860.82 African American 10 0??? Hispanic of Any Race 12.815.44159.1 Economically Disadvantaged 10.513.6106.2 English Learners 10 0??? Students with Disabilities 10 0???

15
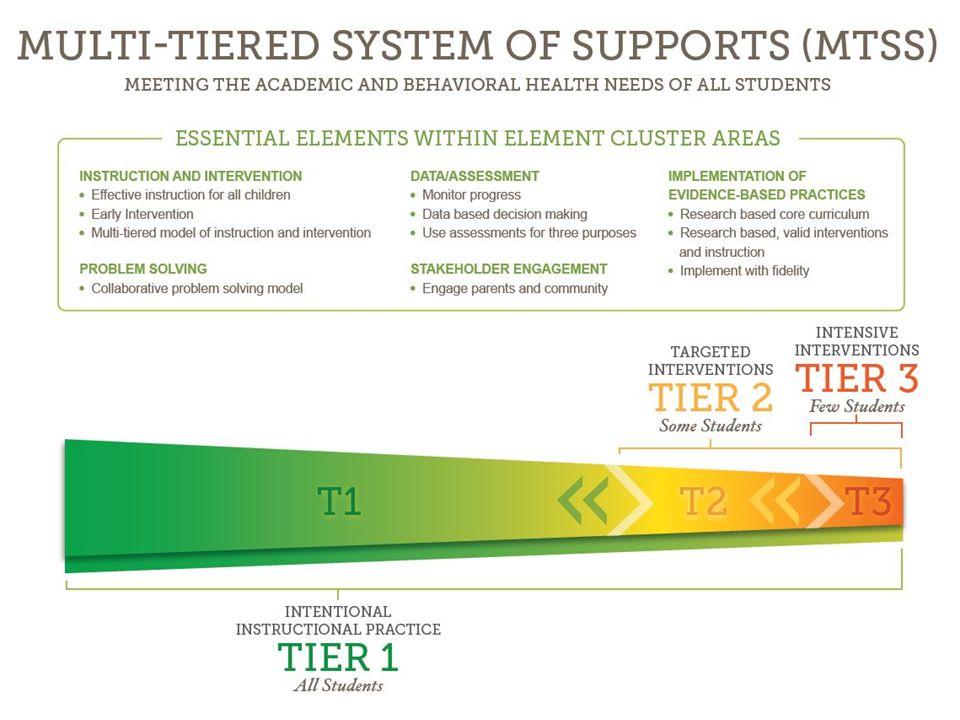
15 School-Wide System of Supports for Student Success Universal Intervention [80%] Core Instruction Differentiation All students Preventive Targeted Intervention [15%] Supplemental, some students, reduce risk Intensive Intervention [5%] Individualized, functional assessment, highly specific
![15 School-Wide System of Supports for Student Success Universal Intervention [80%] Core Instruction Differentiation All students Preventive Targeted Intervention [15%] Supplemental, some students, reduce risk Intensive Intervention [5%] Individualized, functional assessment, highly specific](http://images.slideplayer.com/33/7433940/slides/slide_15.jpg "15 School-Wide System of Supports for Student Success Universal Intervention [80%] Core Instruction Differentiation All students Preventive Targeted Intervention [15%] Supplemental, some students, reduce risk Intensive Intervention [5%] Individualized, functional assessment, highly specific")
17
When Standards, Instruction, and Culture intersect, we’ll see… Standard s Culture Instruction Intentional Instructional Practice

19
Accountability Services Education Services Office of Great Start MDE Administrative Services

20
Intermediate School Districts Community Mental Health Michigan Rehabilitation Services Other State & Local Agencies Local Educational Agencies Institutions of Higher Education IDEA Grant Funded Initiatives

22
Coordination & Collaboration

24
Conceptual Framework for Improving Results for Children Coherent Infrastructure Quality Data Improved Results Effective Practices

Similar presentations
 Sharing with ESC Providers September 22 nd, 2008.>")


 will partner with an approved service provider to deliver literacy readiness.>")


