Download presentation
Presentation is loading. Please wait.

1
actual forecast NGLs Coalbed methane Hydro, wind, and other renewables Conventional natural gas Mined and in situ bitumen Conventional heavy oil Conventional L&M oil Coal Figure 1 Total energy production in Alberta

2
Figure 1.1 OPEC crude basket reference price 2007

4
Figure 1.3 Price of WTI at Chicago actualforecast High Low

5
Figure 1.4 Average price of oil at Alberta wellhead actualforecast High Low

6
Figure 1.5 2006 Average monthly reference prices of Alberta crudes Figure 1.5 2007 average monthly reference prices in Alberta 100 200 300 400 500 600

8
Figure 1.7 Average price of natural gas at plant gate actualforecast high low

9
Figure 1.8 Alberta Wholesale Electricity Prices actualforecast

11
Figure 1.10 Canadian economic indicators

12
Figure 1.11 Alberta real investment actualforecast Source: Statistics Canada, Canadian Association of Petroleum Producers *includes support activities to mining and oil and gas extraction

14
Figure 3 Alberta supply of crude oil and equivalent actualforecast Non upgraded bitumen Light-medium SCO Pentanes plus Heavy

15
actualforecast 10.7 7.1 5.3 3.6 1.8 0 Tcf Figure 4 Total marketable gas production and demand 25%27%31%41%50%

16
Bitumen* - includes producing and evaluation wells Gas** - includes CBM wells Other *** - includes unsuccessful, service, and suspended wells Figure 5 Drilling Activity in Alberta, 1948-2007

17
Figure 6 Alberta Conventional Crude Oil Production and Price Source: Prices - CAPP Statistical Handbook EUB Prorationing Plan (restricted production) Major Oil Field Discoveries 1947 – Leduc 1948 – Redwater 1949 – Golden Spike 1952 – Bonnie Glen 1953 – Pembina 1957 – Swan Hill 1959 – Judy Creek 1959 – Swan Hill South 1965 - Rainbow Major Events Affecting Price 1973 – Oil Embargo 1979 – Iranian Revolution 1980 – Iran / Iraq War 1986 – OPEC Crumbles 1990 – Gulf War 1998 – Asian Econ. Crisis 2001 – 9 / 11 2003 – Iraq War 1938 - Petroleum and Natural Gas Conservation Board (EUB) created to enforce production standards Export Pipelines 1950 – Interprovincial Pipeline (Enbridge) 1953 – Trans Mountain Pipe Line
 created to enforce production standards Export Pipelines 1950 – Interprovincial Pipeline (Enbridge) 1953 – Trans Mountain Pipe Line.")
18
Figure 7 Alberta mined bitumen and synthetic crude oil production and price Cdn$/cubic metre Great Canadian Oil Sands (Suncor) Startup Syncrude Startup Alberta Oil Sands Project Startup
 Startup Syncrude Startup Alberta Oil Sands Project Startup")
19
Figure 8 Alberta in situ bitumen production and price Cdn$/cubic metres

20
Figure 9 Historical natural gas production and price Gas prices as a by-product of oil production. Price less than replacement cost Arbitration awards price increase Regulated gas price tied to oil prices. Surplus built up Price deregulation Surplus gas drives down prices PGT expansion Late 1998: Northern Border/TCPL expansion 2000: Alliance Pipeline Hurricanes Katerina and Rita hit U.S. Gulf Coast Foothills Pipe Lines built for gas exports to California and the mid-western U.S. 1956: TransCanada Pipelines built to take Alberta gas to central Canada and the U.S. after debate over its charter in Parliament

21
Figure 10 Sulphur closing inventories in Alberta and price

22
1898 – Expansion of railway network (coal and oil fired steam engines) and growth of population 1952 – Beginning of change to diesel-electric trains 1960 – Steam rail era ends Late1960’s – Beginning of exports to Japan for steel industry 1970’s – increase in coal-fired electric generation 1950’s – Crude oil and natural gas replace coal as energy source of choice Coal remained “King Coal” until huge reservoirs of crude oil and natural gas were discovered Figure 11 Historical coal production and price Australian-Japan contract price for thermal coal (Australian Bureau of Agricultural and Resource Economics - ABARE) Late 1990’s – mine closures and reduced coal exports due to depressed coal prices
 and growth of population 1952 – Beginning of change to diesel-electric trains 1960 – Steam rail era ends Late1960’s – Beginning of exports to Japan for steel industry 1970’s – increase in coal-fired electric generation 1950’s – Crude oil and natural gas replace coal as energy source of choice Coal remained King Coal until huge reservoirs of crude oil and natural gas were discovered Figure 11 Historical coal production and price Australian-Japan contract price for thermal coal (Australian Bureau of Agricultural and Resource Economics - ABARE) Late 1990’s – mine closures and reduced coal exports due to depressed coal prices")
24
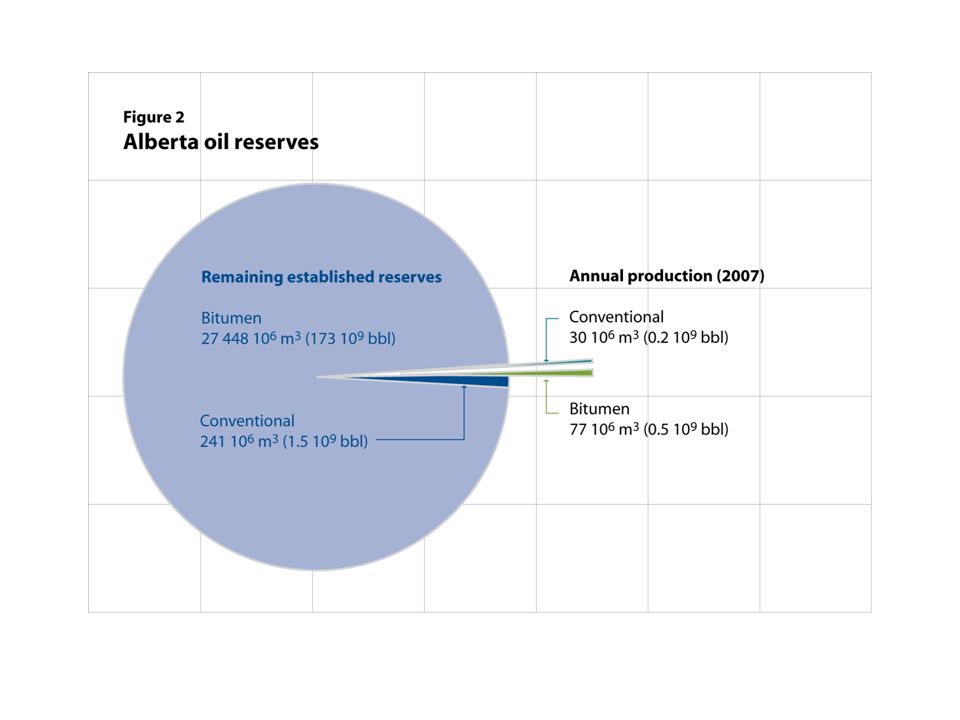
Figure 2.2 Remaining established reserves under active development

30
Figure 2.8 Alberta crude oil and equivalent production

31
Figure 2.9 Total in situ bitumen production and producing bitumen wells Production (10 3 m 3 /d)
")
32
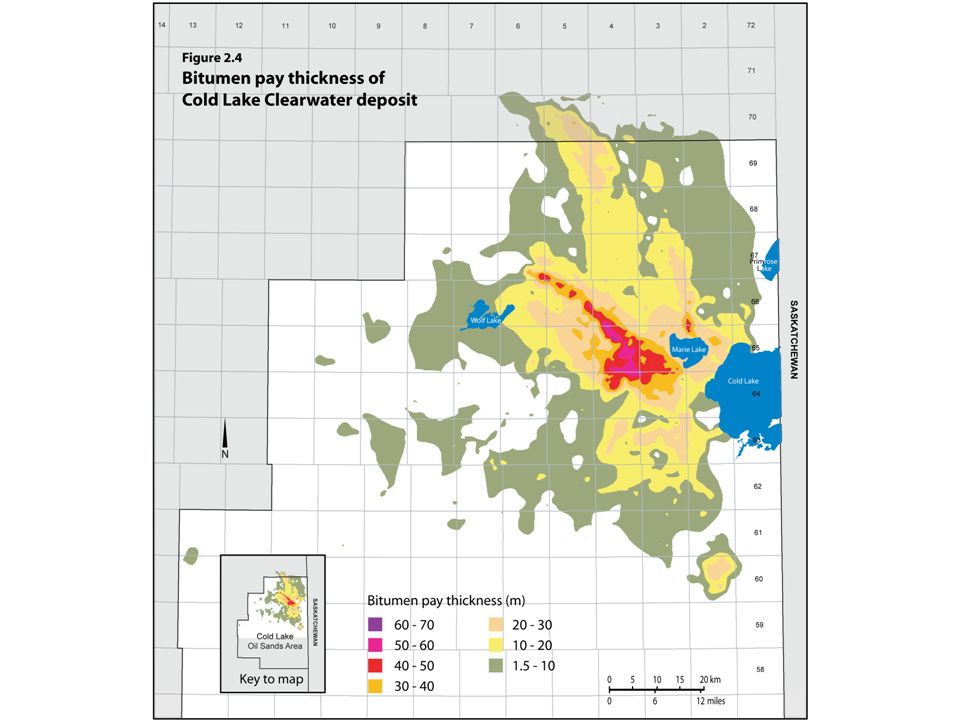
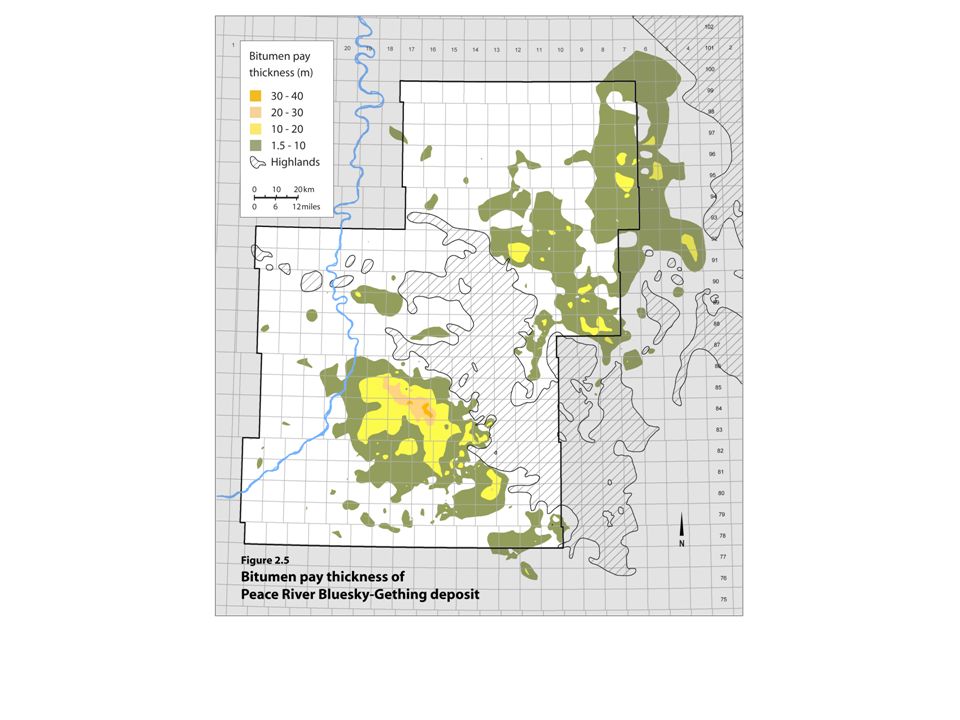
Figure 2.10 In situ bitumen production by oil sands area (OSA) Synthetic Crude Oil Cold Lake OSA Athabasca OSA Peace River OSA
 Synthetic Crude Oil Cold Lake OSA Athabasca OSA Peace River OSA")
33
Figure 2.11 In situ bitumen production by recovery method Synthetic Crude Oil Primary Production CSS Production SAGD Production Experimental Production

34
Figure 2.12 Alberta crude bitumen production Surface mining In situ actualforecast

35
Figure 2.13 Alberta synthetic crude oil production Synthetic Crude Oil Synthetic crude oil actualforecast

38
Figure 2.16 Alberta oil sands upgrading coke inventory Synthetic Crude Oil Oil Sands Plants – Coke Inventory

39
Figure 2.17 Alberta demand and disposition of crude bitumen and SCO Synthetic Crude Oil Alberta demand (mainly SCO) actualforecast SCO removals from Alberta Nonupgraded bitumen removals from Alberta
 actualforecast SCO removals from Alberta Nonupgraded bitumen removals from Alberta")
40
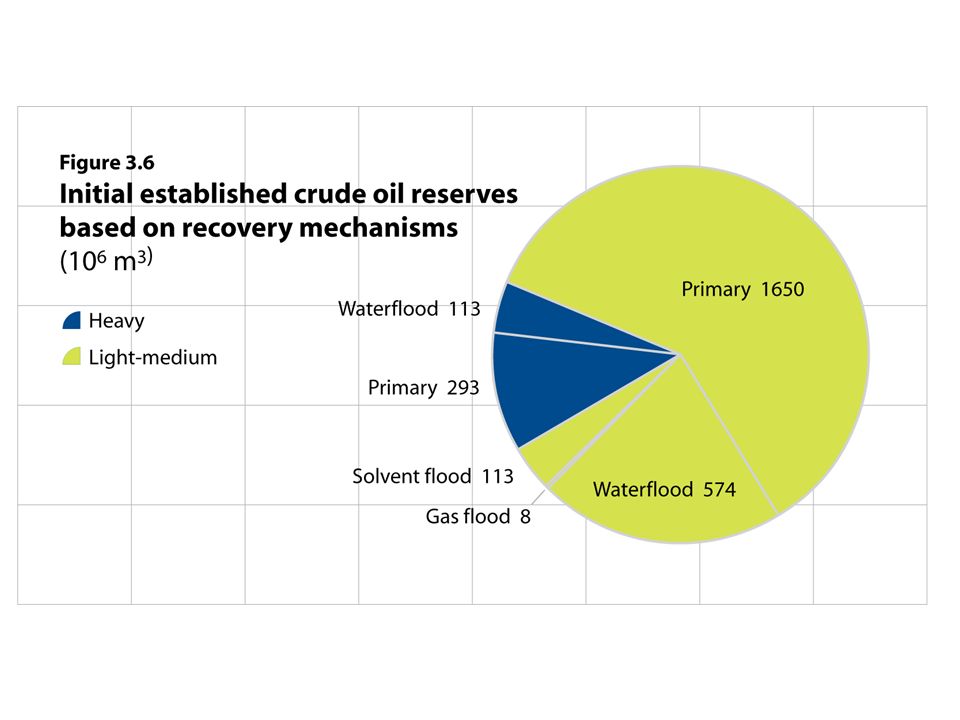
Figure 3.1 Remaining established reserves of crude oil Heavy Light-medium

41
Figure 3.2 Annual changes in conventional crude oil reserves

42
Figure 3.3 Annual changes to waterflood reserves

43
Figure 3.4 Distribution of oil reserves by size Remaining reserves (10 3 m 3 ) Total number of pools (10 3 m 3 ) Initial reserves (10 3 m 3 )
 Total number of pools (10 3 m 3 ) Initial reserves (10 3 m 3 )")
44
Figure 3.5 Oil pool size by discovery year

46
Figure 3.7 Geological distribution of reserves of conventional crude oil

48
Figure 3.9 Alberta’s remaining established oil Reserves versus cumulative production

53
Figure 3.14 Conventional crude oil production by modified PSAC area PSAC 8 PSAC 7 PSAC 5 PSAC 3 PSAC 4 PSAC 2 PSAC 1

54
Figure 3.15 Total crude oil production and producing wells

56
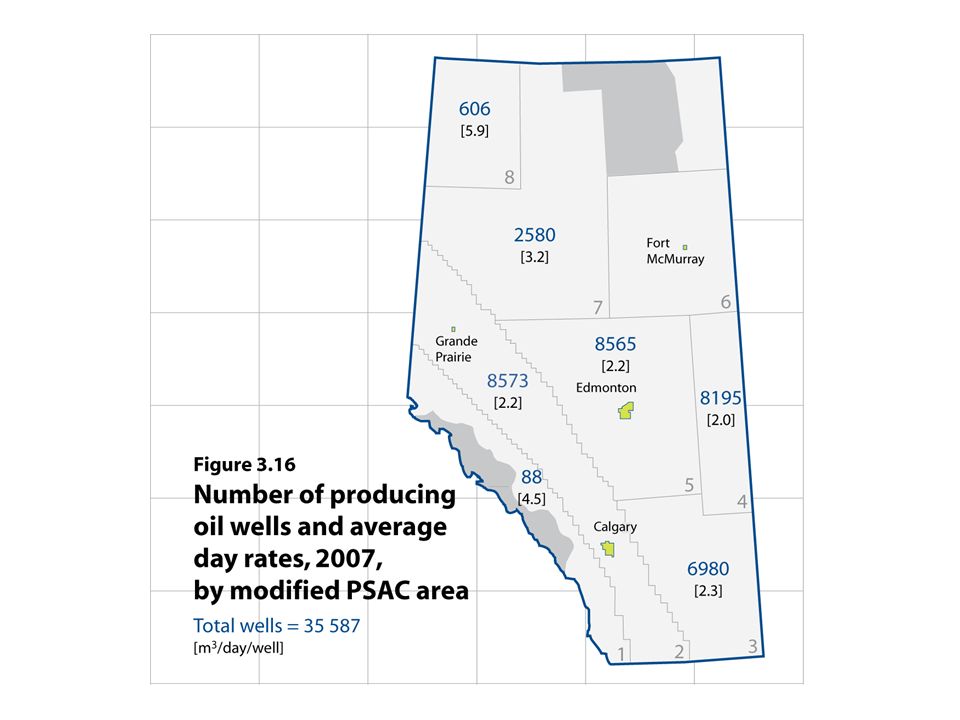
Figure 3.17 Crude oil well productivity in 2007

57
Figure 3.18 Total conventional crude oil production by drilled year % of total production from oil wells Pre-1998 2007 2006 2005 2004 2002 2003 2001 2000 1998 10% 47% 6% 4% 2% 3% 4% 5% 6% 8%

58
Figure 3.19 Comparison of crude oil production Texas onshore Louisiana onshore Alberta crude oil

59
Figure 3.20 WTI crude oil price and well activity actualforecast

60
actualforecast Figure 3.21 Alberta daily production of crude oil Heavy Light-medium

61
Figure 3.22 Capacity and location of Alberta refineries

62
actualforecast Figure 3.23 Alberta demand and disposition of crude oil Crude oil removals from Alberta Alberta demand

63
Figure 3.24 Alberta supply of crude oil and equivalent actualforecast Non upgraded bitumen Light-medium SCO Pentanes plus Heavy

64
Figure 3.25 Alberta crude oil and equivalent production actualforecast

70
Figure 4.6 Coalbed methane production forecast from CBM wells actual forecast

71
Figure 5.1 Annual reserves additions and production of conventional marketable gas

72
Figure 5.2 Remaining conventional marketable gas reserves

73
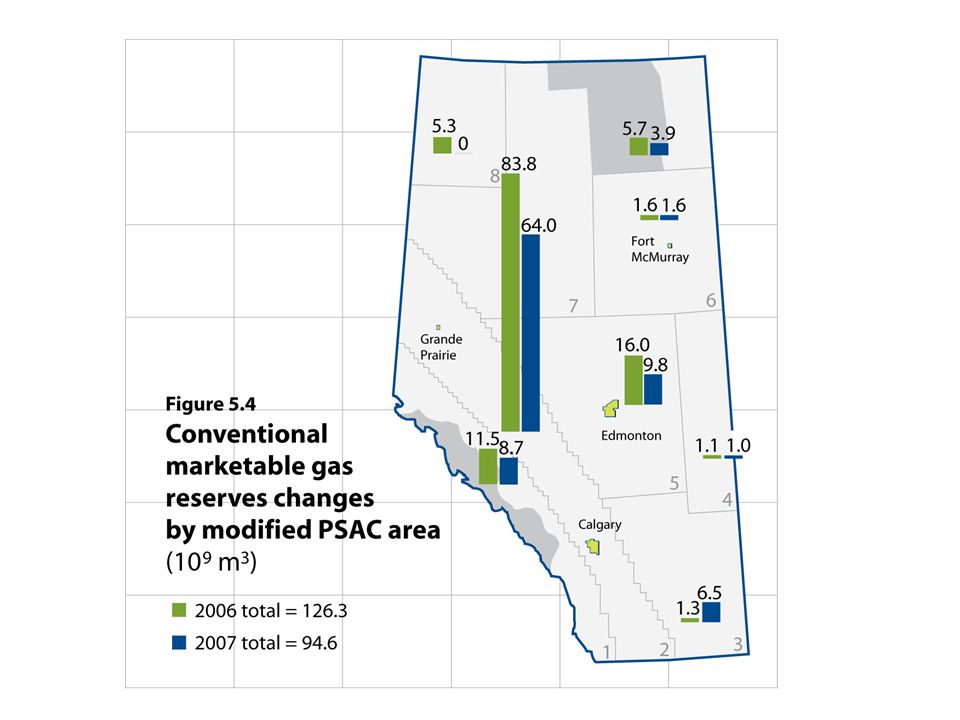
Figure 5.3 New, development, and revisions to conventional marketable gas reserves

75
Figure 5.5 Distribution of conventional gas reserves by size Remaining reserves (10 9 m 3 ) Total number of pools (10 6 m 3 ) Initial reserves (10 9 m 3 )
 Total number of pools (10 6 m 3 ) Initial reserves (10 9 m 3 )")
76
Figure 5.6 Conventional gas pools by size and discovery year

77
Figure 5.7 Geological distribution of conventional marketable gas reserves

78
Figure 5.8 Remaining conventional marketable reserves of sweet and sour gas Sweet natural gas Sour natural gas

79
Figure 5.9 Expected recovery of conventional natural gas components

81
Figure 5.11 Conventional gas ultimate potential Ultimate potential based on 2004 study Remaining reserves Production

83
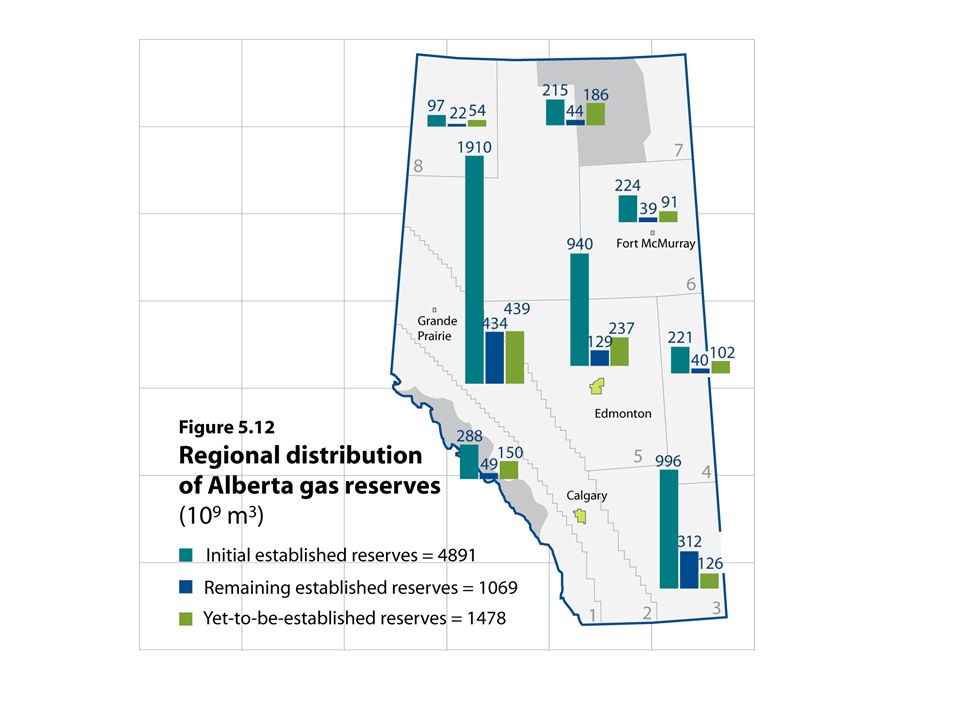
Figure 5.13 Conventional gas in place by geological period

85
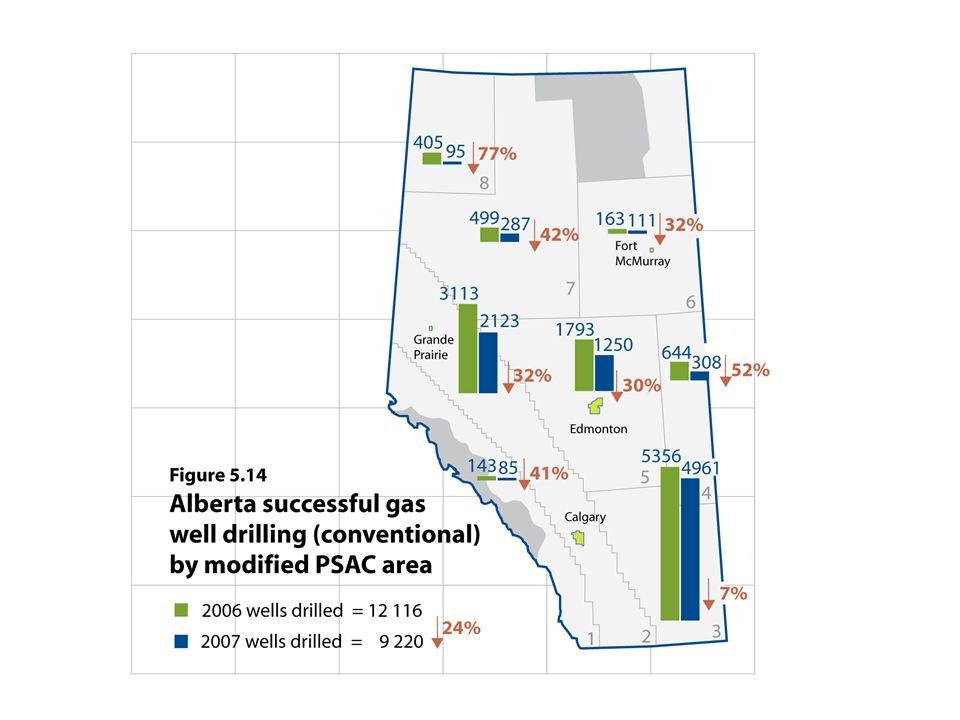
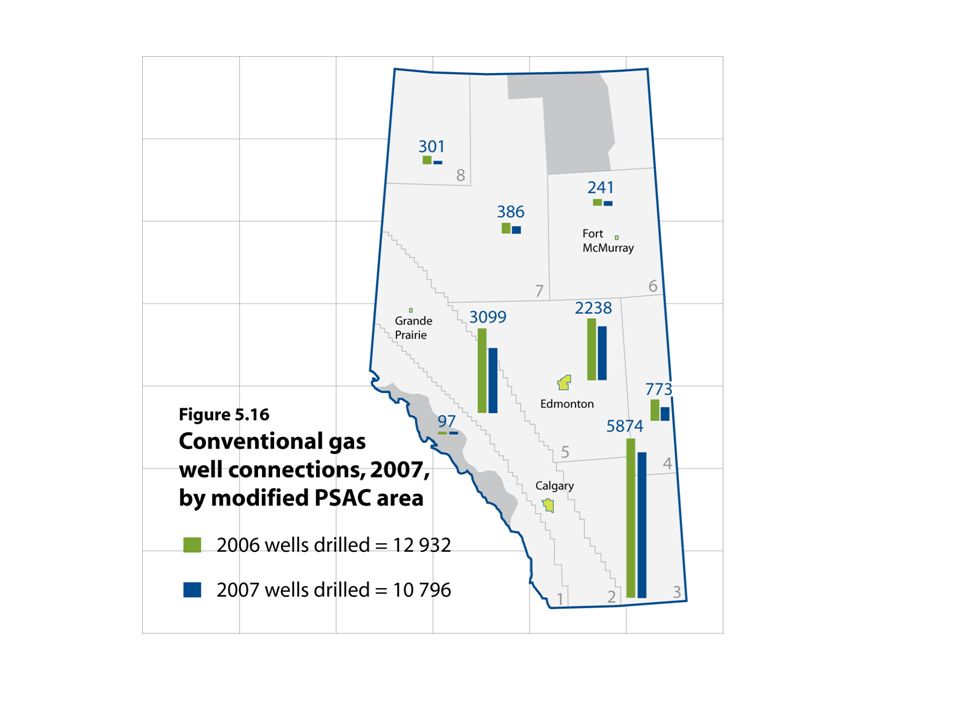
Figure 5.15 Successful conventional gas wells drilled and connected

88
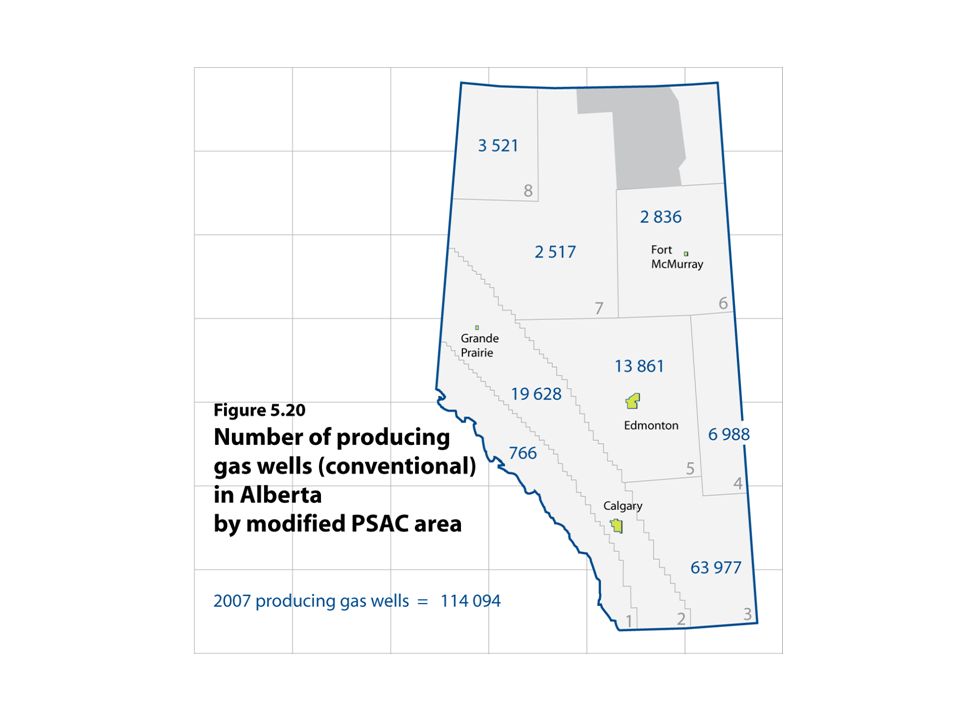
Figure 5.18 Marketable gas production by modified PSAC area PSAC 6 PSAC 4 PSAC 5 PSAC 2 PSAC 3 PSAC 1 Gas from oil wells PSAC 7 PSAC 8 % of total production 2% 4% 3% 11% 4% 20% 41% 6% 9%

89
Figure 5.19 Conventional marketable gas production and number of producing wells

92
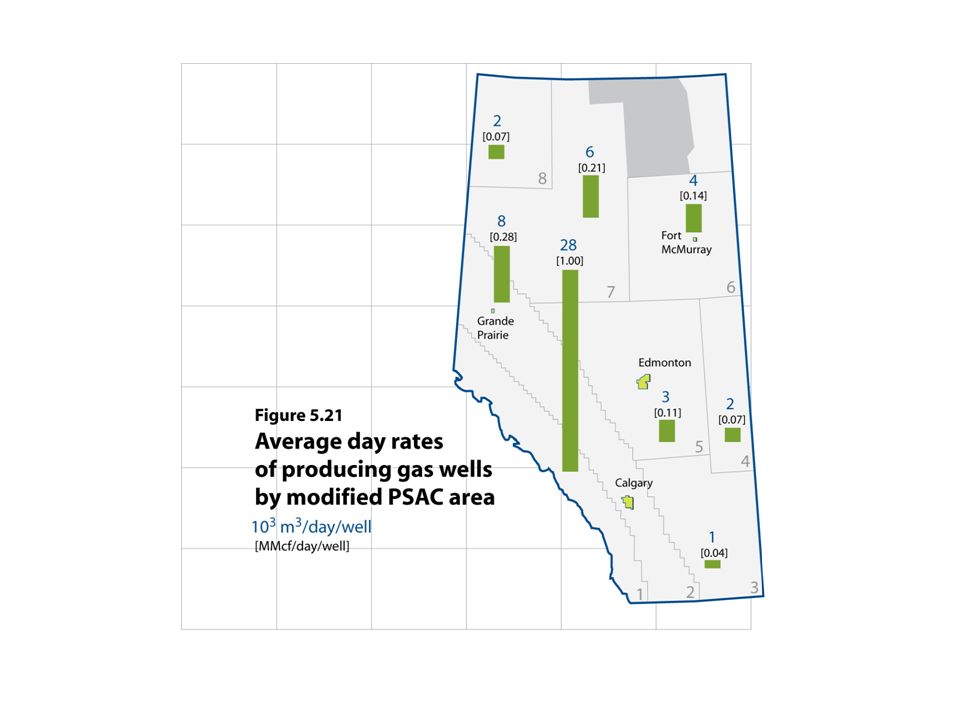
Figure 5.22 Natural gas well productivity in 2007

93
Pre - 1998 200720062005200420022003200120001999 1998 Gas from oil wells Figure 5.23 Raw gas production by connection year % of total production from gas wells 3 Connection year 3 4 26 9 7 11 10 16 5 6

94
Figure 5.24 Raw gas production of sweet and sour gas

95
Figure 5.25 Comparison of raw natural gas production Texas onshore Louisiana onshore Alberta US total production

96
Figure 5.26 Average initial natural gas well productivity in Alberta

97
Figure 5.27 Alberta natural gas well activity and price actualforecast

98
Figure 5.28 Conventional marketable gas production actualforecast 7.1 5.3 3.6 1.8 0 Tcf

99
Figure 5.29 Gas production from bitumen upgrading and bitumen wells used for oil sands operations actualforecast

100
Figure 5.30 Total gas production in Alberta actualforecast

101
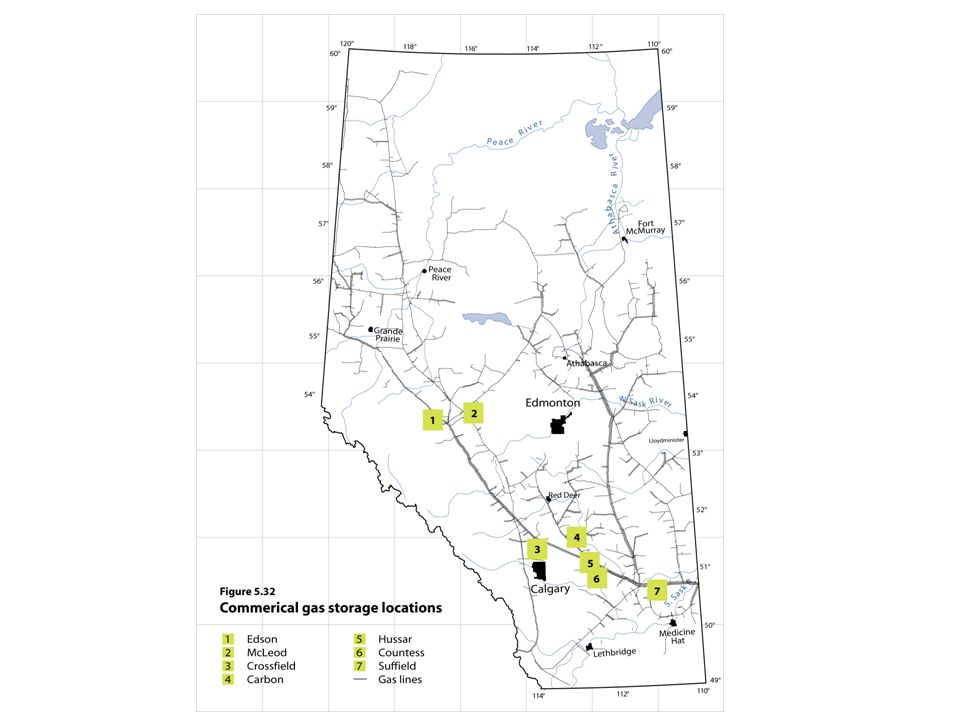
Figure 5.31 Alberta natural gas storage injection/withdrawal volumes

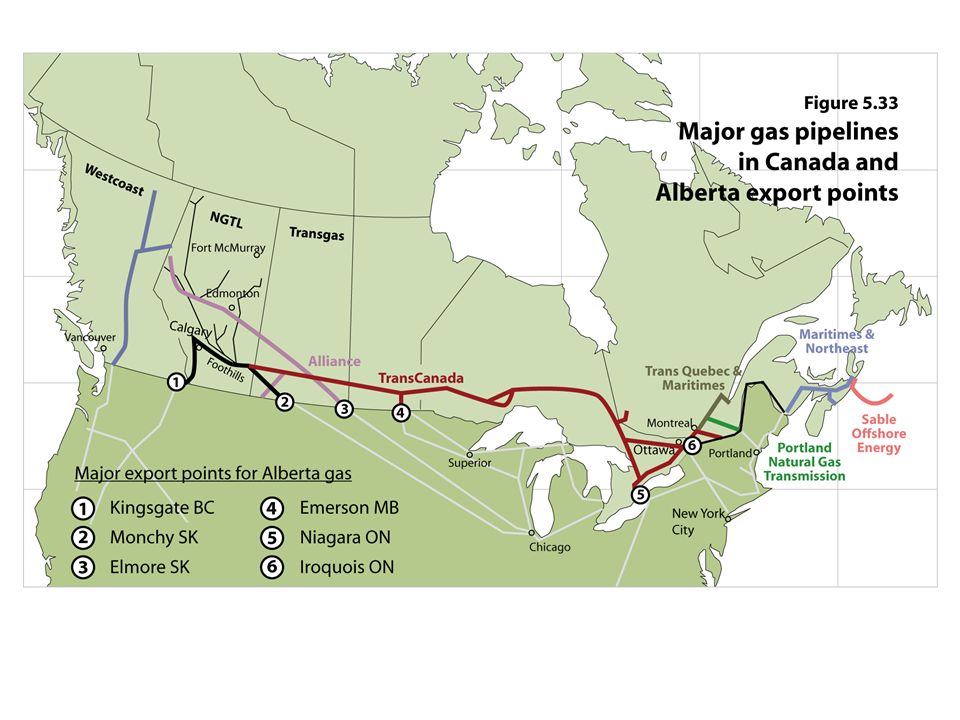
104
Figure 5.34 Alberta marketable gas demand by sector Reprocessing plant shrinkage Transportation Electricity generation Other industrial Industrial - petrochemical Industrial – oil sands Residential Commercial actualforecast

105
Figure 5.35 Historical volumes “available for permitting”

106
actual forecast Mining and Upgrading In Situ In Situ Cogeneration Mining and Upgrading Cogeneration Figure 5.36 Purchased natural gas demand for oil sands operations

107
Figure 5.37 Gas demand for bitumen recovery and upgrading actualforecast Purchased gas Produced gas from bitumen Process gas from upgrading* * Does not included process gas for electricity generation.

108
actual forecast Process Gas for Mining/Upgrading Produced Gas from Bitumen Wells for In situ Recovery Purchased Gas for In situ Recovery Purchased Gas for Electricity Cogeneration Purchased Gas for Mining/Upgrading Process Gas for Electricity Cogeneration Figure 5.38 Total Purchased, Process and Produced Gas for Oil Sands Production

109
actualforecast 10.7 7.1 5.3 3.6 1.8 0 Tcf Figure 5.39 Total marketable gas production and demand 25%27%31%41%50%

110
Figure 6.1 Remaining established NGL reserves expected to be extracted from conventional gas and annual production

111
Figure 6.2 Remaining established reserves of conventional natural gas liquids

113
Figure 6.4 Ethane Supply and Demand 10 3 m 3 /d Actual Forecast

114
Figure 6.5 Propane supply from natural gas and demand 10 3 m 3 /d Actual Forecast * excludes solvent flood volumes

115
Figure 6.6 Butanes supply from natural gas and demand 10 3 m 3 /d Actual Forecast * excludes solvent flood volumes

116
Figure 6.7 Pentanes plus supply from natural gas and demand for diluent 10 3 m 3 /d Actual Forecast * excludes solvent flood volumes Demand met by alternative sources and types of diluent

117
Figure 7.1 Sources of sulphur production Sour gas Refining and upgrading

118
Figure 7.2 Sulphur production from gas processing plants in Alberta

119
Figure 7.3 Sulphur production from oil sands

120
Figure 7.4 Canadian sulphur offshore exports

121
Figure 7.5 Sulphur demand and supply in Alberta Alberta demand Removed from Alberta Stockpile actualforecast Stockpile Withdrawal Total Demand Production

123
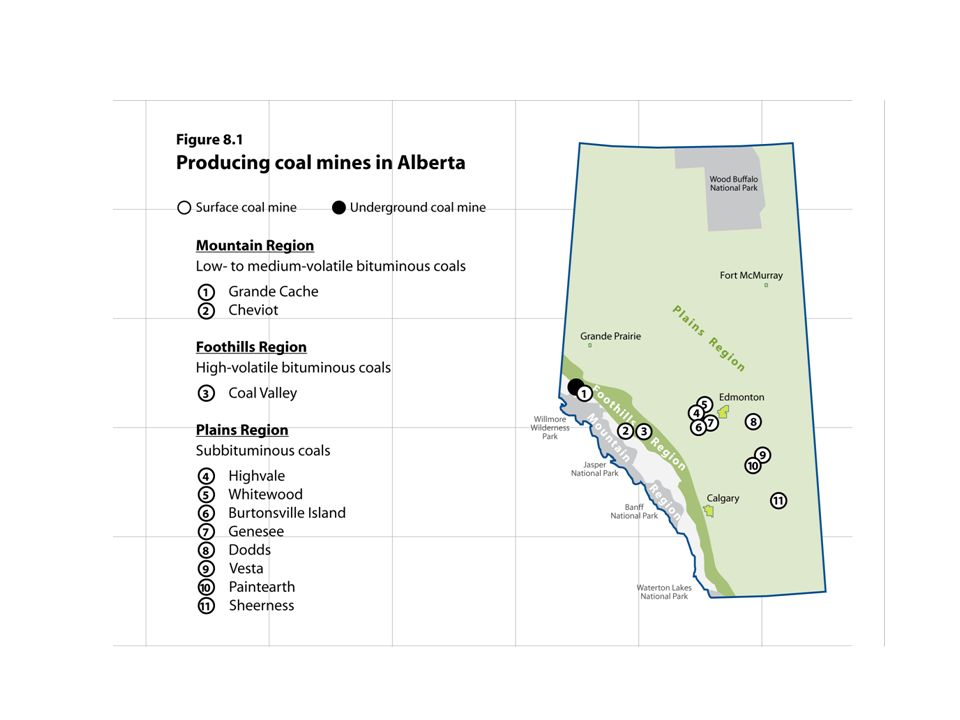
million tonnes Subbituminous Thermal bituminous Metallurgical bituminous Figure 8.2 Alberta marketable coal production

124
actualforecast Figure 9.1. Alberta electricity generating capacity

125
actualforecast Figure 9.2. Alberta electricity generation

126
Figure 9.3. Alberta electricity transfers

127
Figure 9.4. Alberta electricity consumption by sector actualforecast

128
9.5. Alberta oil sands electricity generation and demand * Industrial – oil sands historical data on electricity demand was estimated using an assumption of 10 kWh/bbl for thermal in situ oil sands projects that do not operate cogeneration units. actualforecast Electricity Generation Demand

Similar presentations


 Source: U.S. Energy Information Administration, Annual Energy Review 2009, Tables.>")


