Download presentation
Presentation is loading. Please wait.

1
Height and weight as predictors of achievement, grade repetition and dropout in rural Peru Santiago Cueto Group for the Analysis of Development (GRADE)
")
2
Peru - Study areas

3
Longitudinal Design 1998199920002001 Ideal progress4th grade5th grade6th grade 1st grade high school Data collected Baseline (Achievement and Anthropometry) NoAchievement Grade in school
 NoAchievement Grade in school")
4
Number of students by grades and situation in 2001 Primary school High school Total% Fourth grade Fifth grade Sixth grade First grade Attending45714725045880% Dropout60421611820% Total6499163 250576100%

5
Situation of dropouts from 2000 to 2001 Situation FemalesMales Returned to school7%3% Maintained its condition 57%33% Total64%36% n=86

6
Age, height, weight of students in 1998 by situation in 2001 AttendingRetainedDropouts MSDM M Height for age-2.2 a 1.0-2.2 a 0.9-2.3 a 1.0 Student's age11.4 a 1.711.0 a 1.513.1 b 2.1 Weight for age-1.4 a 0.8-1.4 a 0.7-1.3 a 0.8 Body mass index17.1 a 1.716.8 a 1.418.5 b 2.3 *Means with different superscripts in each group indicate differences are significant (p<0.05).
.")
7
Other Characteristics of the students according to their condition in 2001 AttendingRetainedDropouts MSDM M Proportion of students who attended preschool0.68 a 0.470.68 a 0.470.63ª0.49 Student’s proficiency in Spanish (3 point scale)2.45 a 0.662.13 b 0.752.16 b 0.73 Number of siblings2.69 a 1.342.78 a 1.432.99ª1.63 Number of education books in the house (school texts, dictionaries, tales)4.26 a 1.713.96ª1.623.51 b 1.71 Proportion of the students who live with one or two parents0.94 a 0.250.86 b 0.350.59 c 0.49 Father’s education4.97 a 3.354.51ª3.093.82 b 2.86 Mother’s education2.73 a 3.442.57ª2.791.65 b 2.04 Mother uses Spanish to communicate with her child (proportion)0.64 a 0.480.45 b 0.50.38 b 0.49 Number of rooms in the house (without bathroom, kitchen, garage)2.61 a 1.552.32 a 1.451.91 b 1.23 Time from the house to school (in minutes)22.84 a 22.9128.68 a 32.7634.66ª41.06 *Means with different superscripts in each group indicate differences are significant (p<0.05).
2.45 a b b 0.73 Number of siblings2.69 a a ª1.63 Number of education books in the house (school texts, dictionaries, tales)4.26 a ª b 1.71 Proportion of the students who live with one or two parents0.94 a b c 0.49 Father’s education4.97 a ª b 2.86 Mother’s education2.73 a ª b 2.04 Mother uses Spanish to communicate with her child (proportion)0.64 a b b 0.49 Number of rooms in the house (without bathroom, kitchen, garage)2.61 a a b 1.23 Time from the house to school (in minutes)22.84 a a ª41.06 *Means with different superscripts in each group indicate differences are significant (p<0.05).")
8
Scores in Arithmetic test – common items (maximum possible score: 13 points) Grade in 2001 Arithmetic test (1998) Arithmetic test (2000) Variation (2000- 1998) Fourth and Fifth graders Mean4.3 c 7.5 b 3.2 Standard deviation2.52.8 N48 Sixth graders Mean5.0 c 8.4 b 3.5 Standard deviation2.32.7 N129 High school First graders Mean7.2 a 10.2 a 3.0 Standard deviation2.72.4 N222 Dropouts Mean6.2 b 7.9 b 1.6 Standard deviation2.53.3 N69 *Tests with different superscripts within each test administrated indicate differences are significant at the 5%.
 Grade in 2001 Arithmetic test (1998) Arithmetic test (2000) Variation ( ) Fourth and Fifth graders Mean4.3 c 7.5 b 3.2 Standard deviation N48 Sixth graders Mean5.0 c 8.4 b 3.5 Standard deviation N129 High school First graders Mean7.2 a 10.2 a 3.0 Standard deviation N222 Dropouts Mean6.2 b 7.9 b 1.6 Standard deviation N69 *Tests with different superscripts within each test administrated indicate differences are significant at the 5%.")
9
Reading comprehension – common items (maximum possible score: 40 points) Grade in 2001 Reading comprehension test (1998) Reading comprehension test (2000) Variation (200- 1998) Fourth and Fifth graders Mean12.3 b 19.7 c 7.4 Standard deviation6.36.2 N59 Sixth graders Mean13.5 b 23.4 b 9.9 Standard deviation5.75.1 N143 High school First graders Mean19.4 a 26.8 a 7.3 Standard deviation6.25.6 N239 Dropouts Mean13.9 b 21.0 b,c 7.1 Standard deviation6.58.0 N78 *Tests with different superscripts within each test administrated indicate differences are significant at the 5%.
 Grade in 2001 Reading comprehension test (1998) Reading comprehension test (2000) Variation ( ) Fourth and Fifth graders Mean12.3 b 19.7 c 7.4 Standard deviation N59 Sixth graders Mean13.5 b 23.4 b 9.9 Standard deviation N143 High school First graders Mean19.4 a 26.8 a 7.3 Standard deviation N239 Dropouts Mean13.9 b 21.0 b,c 7.1 Standard deviation N78 *Tests with different superscripts within each test administrated indicate differences are significant at the 5%.")
10
Results in Reading comprehension and arithmetic tests in 2000 – additional items (maximum possible score: 17 and 29 points respectively) Grade in 2001 Reading comprehension* Arithmetic* Fourth and Fifth graders Mean5.5 ª4.3 b Standard deviation2.84.3 N6160 Sixth graders Mean5.3 ª5.4 b Standard deviation3.04.0 N144146 High school First graders Mean6.0 a 7.8 a Standard deviation3.14.9 N248247 Dropouts Mean5.9 ª5.9 b Standard deviation3.85.8 N8085 *Tests with different superscripts within each test administrated indicate differences are significant at the 5%.
 Grade in 2001 Reading comprehension* Arithmetic* Fourth and Fifth graders Mean5.5 ª4.3 b Standard deviation N6160 Sixth graders Mean5.3 ª5.4 b Standard deviation N High school First graders Mean6.0 a 7.8 a Standard deviation N Dropouts Mean5.9 ª5.9 b Standard deviation N8085 *Tests with different superscripts within each test administrated indicate differences are significant at the 5%.")
11
Correlation among nutrition variables and achievement ** Correlation significant at 1%, * at 5% (2 tailed)
")
12
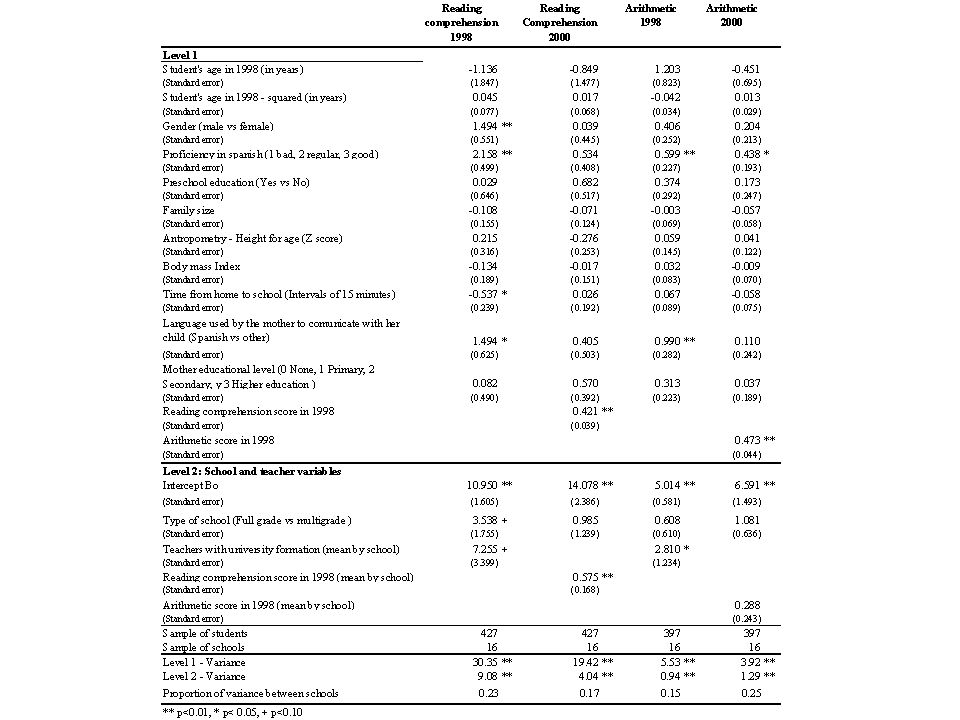
Hierarchical Linear Model analysis for arithmetic and reading comprehension achievement 1998 and 2000 (common items)
")
14
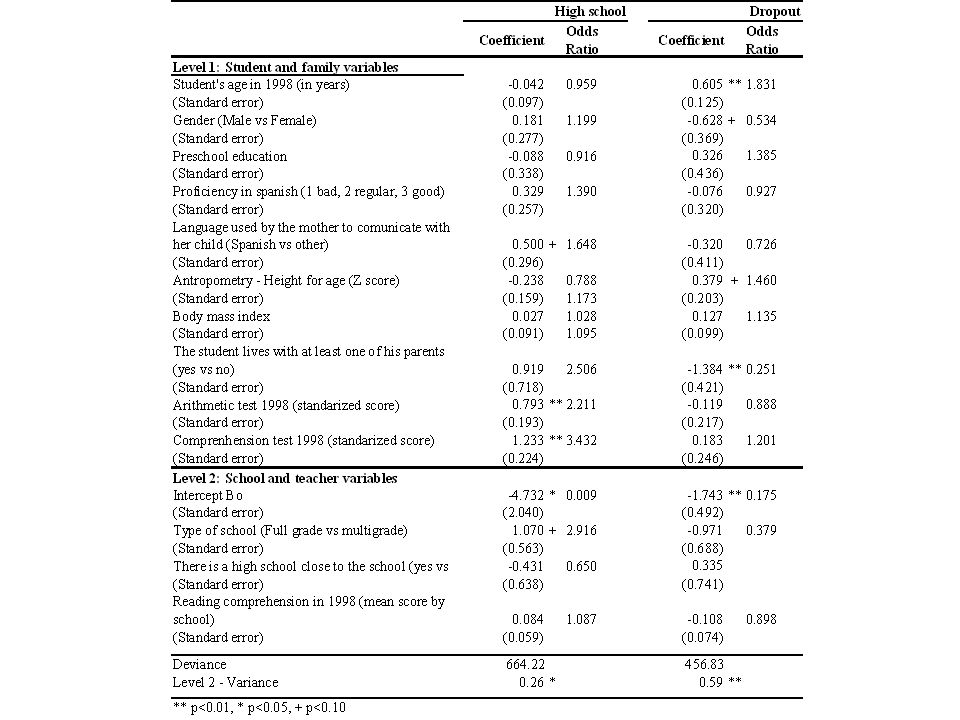
Hierarchical Generalized Nonlinear Model analysis for pass to high school and dropout

Similar presentations


, which became law in July 2012.>")


 Childhood poverty is a major problem in the US –Over 22% of children in the US live in poverty as compared to 9% in.>")


