Download presentation
Presentation is loading. Please wait.

1
NACME-GEM DATA BOOK A Resource for Engineering Collaborations: Preparing Technology Talent for the Economic Turnaround The Intercontinental Hotel Houston, Texas May 28-31, 2003

2
DIVERSITY WITHIN DIVERSITY Proportion of B.S. Degrees Earned by Underrepresented Minorities, By Broad Field, 1990-2000

3
Contents Purpose of the Data Book Demographics & Enrollments Degrees Institutional Production Workforce

4
Purpose of the Data Book NACME and GEM are pleased to provide the data that follow as an authoritative understanding of the state of minority participation in engineering and science education and the workforce. The data derive from the Commission on Professionals in Science and Technology (www.cpst.org), a NACME contractor, based on Engineering Workforce Commission and National Science Foundation data sources.www.cpst.org We have selected a sample of trends and snapshots to inform the discussions at our Engineering Collaborations conference in Houston. Please refer to them!

5
DEMOGRAPHICS

6
Fastest Growing States, 2000-2010 High school-age population (in %) Nevada70 Arizona48 North Carolina31 Florida28 Georgia23 Connecticut23 California20 Massachusetts21 Source: U.S. Census

7
Workforce Growth, by Group 2000-2010 Source: Occupational Outlook Quarterly, Winter 2001-02 (Percent)
")
8
The Road to Engineering The Under-tapped Minority Pool Rounded figures, derived from American Council of Education, and NACME analysis of Engineering Workforce Commission data. High school grad/engineering admits, 1996; Graduates, 2000. Excludes Puerto Rico.

9
ENROLLMENT

10
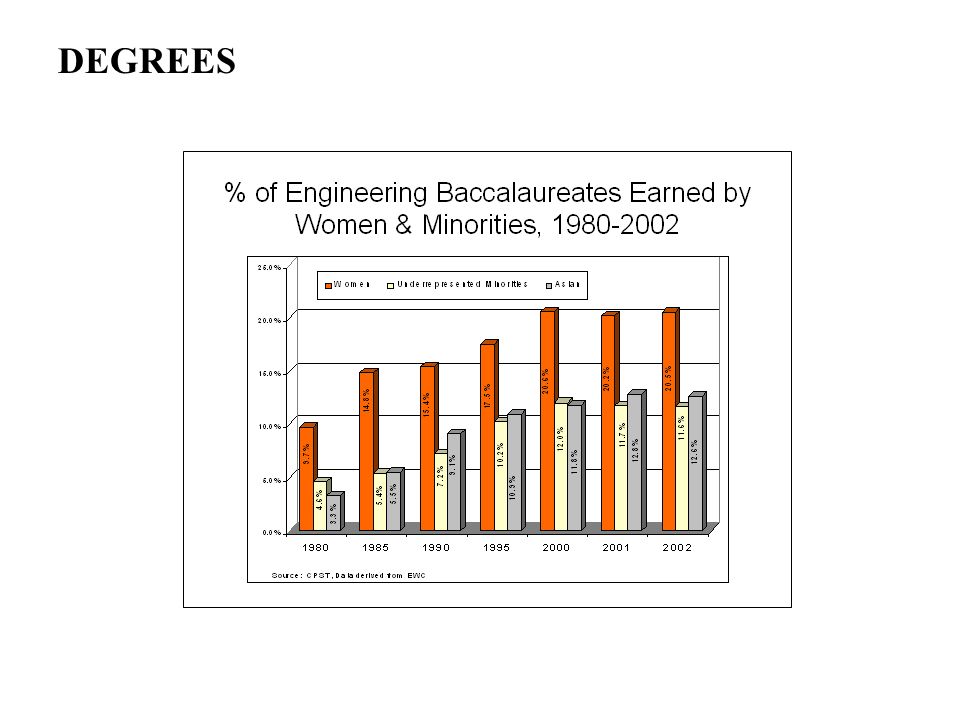
B.S. IN ENGINEERING BY GENDER, MINORITY GROUP AND CITIZENSHIP, 1990-2000 African Native Foreign Women Americans Hispanics Asians Americans Nationals YearTotalNo.% % % % % % 199065,96710,13015.42,1733.32,4733.75,9899.11120.25,1217.8 199163,98610,01615.72,3043.62,6634.26,3059.91460.24,5407.1 199263,6539,97215.72,3743.72,7084.36,47910.21630.34,3896.9 199365,00110,45316.12,6374.12,8454.46,76410.41750.34,6047.1 199464,94610,80016.62,7694.33,0454.76,88110.62070.34,9087.6 199564,74911,30317.52,8974.53,4095.37,05610.92300.44,8937.6 199665,26711,73718.03,1204.83,5575.47,33311.22630.45,0427.7 199765,09112,16018.73,2034.94,0056.27,62511.72650.45,0177.7 199863,27111,79718.63,1445.03,9396.27,13111.33510.65,0838.0 199962,50012,36019.83,1715.14,0736.57,22611.63280.55,0528.1 200063,63513,14020.63,1505.04,1246.57,52911.83470.55,0487.9 Total708,066123,86817.530,9424.436,8415.276,31810.82,5870.453,6977.6 Source: CPST, data derived from Engineering Workforce Commission, Engineering and Technology Degrees 1990 through 2000. DEGREES

16
INSTITUTIONAL PRODUCTION Note: URM = Underrepresented Minorities – African American, Latino, American Indian

17
Note: Retention rates (0-100+%) computed for the 2001 graduating class as a percentage of the 1995 freshman class (including transfer students). No rate appears if freshman class is <10 students or institution failed to report data to EWC. INSTITUTIONAL PRODUCTION

18
Note: Retention rates (0-100+%) computed for the 2001 graduating class as a percentage of the 1995 freshman class (including transfer students). No rate appears if freshman class is <10 students or institution failed to report data to EWC. INSTITUTIONAL PRODUCTION

19
WORKFORCE

Similar presentations


 pantry survey found that.>")


