Download presentation
Presentation is loading. Please wait.

1
IGCP/SIDA Project 594, Annual Workshop, Windhoek, Namibia, 2012 Pathways of exposure to cobalt in populations living in Katanga, D.R. Congo C. Banza Lubaba Nkulu 1, K. Cheyns 2, J. Ngoy Asosa 1, L. Kabamba Ngombe 1, A. Mutombo Mwanza 1, V. Haufroid 3, Th. De Putter 4, O. Luboya Numbi 1, B. Kabyla Ilunga 1, C. Muleka Kimpanga 1, B. Nemery 5, E. Smolders 2 1.Unité de Toxicologie et Environnement, Ecole de Santé Publique, Université de Lubumbashi, Lubumbashi, D.R. Congo 2.Division of Soil and Water Management,Department of Earth and Environmental Sciences, KU Leuven, Leuven, Belgium 3.Laboratoire de Toxicologie Industrielle et Médecine du Travail, U.C. Louvain, Brussels, Belgium 4.Geology, Royal Museum for Central Africa, Tervuren, Belgium 5.Occupational, Environmental and Insurance Medicine, Department of Public Health, KU Leuven, Leuven, Belgium

2
Kamin a Lika si Lubumbas hi Kipus hi 26°0’0’’ E 28°0’0’’ E 10°0’0’’ S 12°0’0’’ S “African copperbelt”

3
Background Evidence of high exposure to several metals (Co, Cu, As, U, …) in the population of south Katanga Evidence of higher exposure in subjects living very close (< 3 km) to mines or smelting plants
 in the population of south Katanga Evidence of higher exposure in subjects living very close (< 3 km) to mines or smelting plants")
4
Aims Main pathways of exposure ? –Air –Dust –Water –Diet (staple foods, vegetables, fish, meat,...) –Work
 –Work.")
5
IGCP/SIDA Project 594, Annual Workshop, Kitwe, Zambia, 2011 Preliminary data –Concentrations of metals in urine of adults and children –Concentration of metals in environmental samples (drinking water, indoor + outdoor dust, fish, chickens) in three areas (Likasi & Lake Changalele)
 in three areas (Likasi & Lake Changalele)")
6
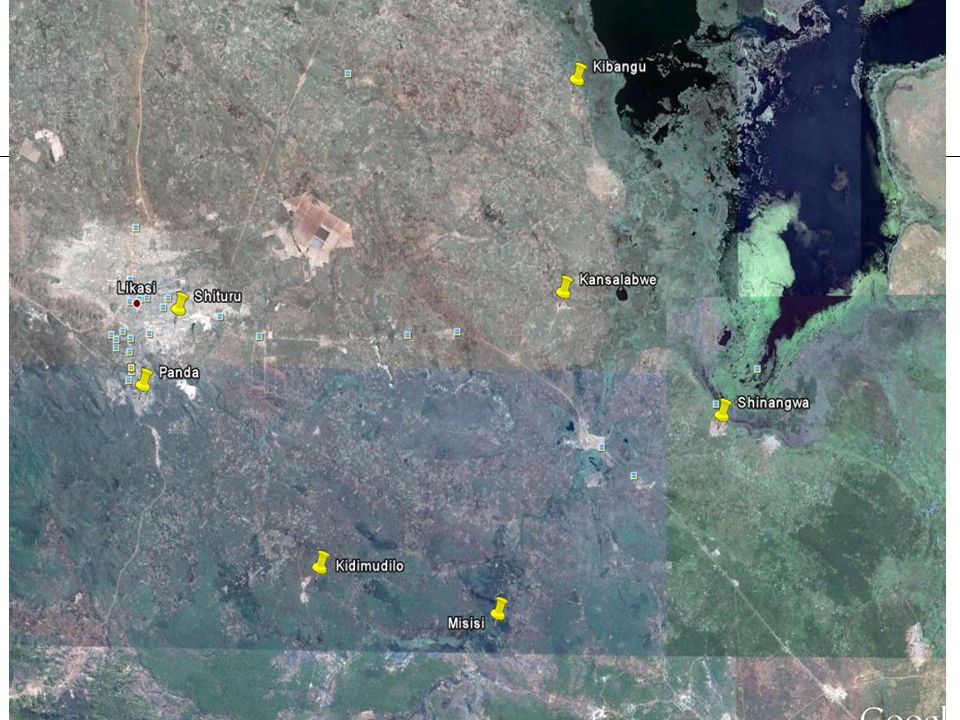
Likasi and Lake Changalele A Control –2 villages : Misisi-Sando (along river Lufira), Kidimudilo B Likasi –2 urban areas in vicinity of metallurgical plants: Q. Shituru, Q. Panda C Lake Changalele (receives effluents from metallurgical plants in Likasi): –3 villages close to Lake Changalele (high fish consumption): Kansalabwe, Shinangwa, Kibangu
: –3 villages close to Lake Changalele (high fish consumption): Kansalabwe, Shinangwa, Kibangu.")
8
R PANDA R. LUFIRA KIBANGU SHINANGWA KANSALABWE KIDIMUDILO MISISI-SANDO SHITURU PANDA

9
Population characteristics nM/F age (y) creatinine (g/L) median [range] A Kidimudilo 4112/29 41[11-78]1.15[0.38-2.77] Misisi-Sando 3317/16 26[4-68]0.93[0.11-3.67] CONTROL 7429/45 35 1.03 B Shituru 42 14/28 21[3-80]1.45[0.22-3.97] Panda 31 14/17 23[3-65]1.47[0.24-3.52] LIKASI 7328/45 231.45 C Kansalabwe 39 16/23 33[6-69]1.57[0.05-3.25] Shinangwa 4219/23 24[2-77]0.65[0.05-4.06] Kibangu 3819/19 27[2-80]1.56[0.13-3.43] CHANGALELE 11954/65 301.19
![Population characteristics nM/F age (y) creatinine (g/L) median [range] A Kidimudilo 4112/29 41[11-78]1.15[ ] Misisi-Sando 3317/16 26[4-68]0.93[ ] CONTROL 7429/ B Shituru 42 14/28 21[3-80]1.45[ ] Panda 31 14/17 23[3-65]1.47[ ] LIKASI 7328/ C Kansalabwe 39 16/23 33[6-69]1.57[ ] Shinangwa 4219/23 24[2-77]0.65[ ] Kibangu 3819/19 27[2-80]1.56[ ] CHANGALELE 11954/](http://images.slideplayer.com/24/7095431/slides/slide_9.jpg "Population characteristics nM/F age (y) creatinine (g/L) median [range] A Kidimudilo 4112/29 41[11-78]1.15[ ] Misisi-Sando 3317/16 26[4-68]0.93[ ] CONTROL 7429/ B Shituru 42 14/28 21[3-80]1.45[ ] Panda 31 14/17 23[3-65]1.47[ ] LIKASI 7328/ C Kansalabwe 39 16/23 33[6-69]1.57[ ] Shinangwa 4219/23 24[2-77]0.65[ ] Kibangu 3819/19 27[2-80]1.56[ ] CHANGALELE 11954/")
10
URINE

12
Kapolowe-Gare: Panda and Lufira rivers jonction

13
Water Substantial contamination of surface waters from Likasi to Lake Changalele No evidence of contamination of drinking water

14
StreetCityCountryWorld Showing category "village" Edit map Map type Categories BNemery EN WikiMapia View Add place 11036019 places Hotel booking Shinangwa 2009 Food Fish

17
DUST

18
Air pollution Likasi 2006

20
CHICKEN

22
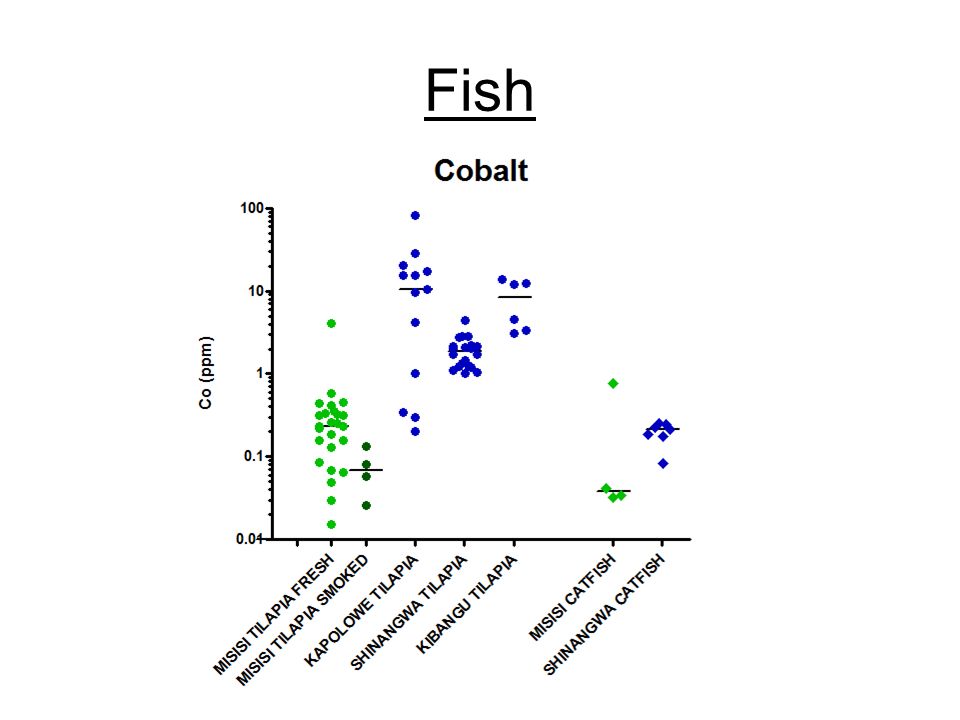
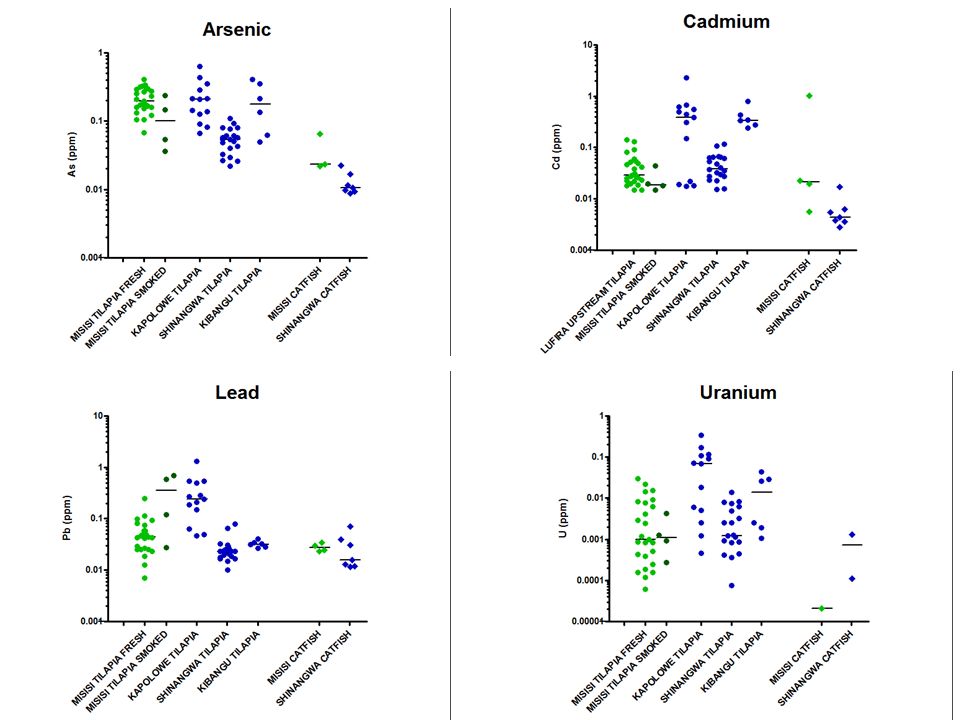
IGCP/SIDA Project 594, Annual Workshop, Kitwe, Zambia, 2011 Preliminary conclusions –Main source of exposure to metals appears to be dust –Fish may also be a significant source –Contribution of vegetables needs to be assessed

23
IGCP/SIDA Project 594, Annual Workshop, Windhoek, Namibia, 2012 Additional data & further analysis re. Co –Concentration of metals in food items (maize flour, locally grown vegetables,...) –Food questionnaire (quantity/quality) –Additional locations 1 urban area in Lubumbashi ( Q. Kabecha ) close to a copper/cobalt processing plant 1 rural area close to a cobalt mine ( Shamitumba ) 2 control locations outside Copperbelt ( Kamina, Mbuji-Mayi )
 –Food questionnaire (quantity/quality) –Additional locations 1 urban area in Lubumbashi ( Q. Kabecha ) close to a copper/cobalt processing plant 1 rural area close to a cobalt mine ( Shamitumba ) 2 control locations outside Copperbelt ( Kamina, Mbuji-Mayi ).")
24
Sampling Volunteers – convenience sampling (family clusters: adults + children) –Simple questionnaire (age, residence, …) –Food questionnaire (1 per household) –Spot sample of urine (avoiding contamination) Soil dust samples (outdoor + indoor) Drinking water Chickens (liver, kidney) + Fish Kitchen gardens (soil, vegetables) + maize flour
 –Simple questionnaire (age, residence, …) –Food questionnaire (1 per household) –Spot sample of urine (avoiding contamination) Soil dust samples (outdoor + indoor) Drinking water Chickens (liver, kidney) + Fish Kitchen gardens (soil, vegetables) + maize flour")
25
Analytical methods Urine Water Animal tissues Vegetables oven dried, acid destruction Soil & dust Analysis by ICP-MS (Inductively Coupled Plasma Mass Spectrometry)
")
26
Estimation of intake of Co Dietary intake based on –food questionnaire (average data) –concentrations of Co in collected samples Dust intake based on –estimate from literature –concentrations of Co in indoor + outdoor dust
 –concentrations of Co in collected samples Dust intake based on –estimate from literature –concentrations of Co in indoor + outdoor dust")
27
Estimated adult dietary intake Control area n=6 Lakeside area n=9 Polluted area n=15 Fraction of total Cereals (g/day) 610 (50)620 (26)610 (47) Maize flour 100 % Vegetables (g/day) 25 (11)28 (14)23 (17) Cassava leaves 25 % Sweet potato leaves 25 % Other leafy vegetables 20 % Fruit vegetables 15 % Beans 5 % Fruit 5 % Other vegetables 5 % Meat (g/day) 0.6 (11)0.1 (0.2)0.5 (0.5) Meat (muscle) 80 % Meat (liver) 10 % Meat (kidney) 10 % Water (mL/day) 1500 (500) Drinking water 100 % Dust (g/day) 0.1 (0.05) Indoordust 33 % Outdoordust 67 % Fish (g/day) 4.1 (1.0)3.1 (0.8)2.5 (1.6) Fish 100 %
 610 (50)620 (26)610 (47) Maize flour 100 % Vegetables (g/day) 25 (11)28 (14)23 (17) Cassava leaves 25 % Sweet potato leaves 25 % Other leafy vegetables 20 % Fruit vegetables 15 % Beans 5 % Fruit 5 % Other vegetables 5 % Meat (g/day) 0.6 (11)0.1 (0.2)0.5 (0.5) Meat (muscle) 80 % Meat (liver) 10 % Meat (kidney) 10 % Water (mL/day) 1500 (500) Drinking water 100 % Dust (g/day) 0.1 (0.05) Indoordust 33 % Outdoordust 67 % Fish (g/day) 4.1 (1.0)3.1 (0.8)2.5 (1.6) Fish 100 %")
28
Average Co concentrations (µg/g dry wt) Control + Lakeside areasPolluted areas Maize flour 0.05 (0.05) n=12 0.4 (0.5) n=14 Cassava leaves 1.5 (2.3) n=8 12 (8.1) n=16 Sweet potato leaves 1.1 (0.98) n=9 6.7 (4.2) n=32 Other leafy vegetables 1.2 (1.6) n=54 46 (73) n=52 Fruit vegetables 0.58 (0.55) n=19 12 (10) n=14 Beans 0.84 (1.35) n=15 22 (32) n=11 Fruit 0.58 (0.52) n=3 - Other vegetables 0.45 (0.49) n=16 4.7 (4.8) n=15
 Control + Lakeside areasPolluted areas Maize flour 0.05 (0.05) n= (0.5) n=14 Cassava leaves 1.5 (2.3) n=8 12 (8.1) n=16 Sweet potato leaves 1.1 (0.98) n=9 6.7 (4.2) n=32 Other leafy vegetables 1.2 (1.6) n=54 46 (73) n=52 Fruit vegetables 0.58 (0.55) n=19 12 (10) n=14 Beans 0.84 (1.35) n=15 22 (32) n=11 Fruit 0.58 (0.52) n=3 - Other vegetables 0.45 (0.49) n= (4.8) n=15")
29
Average Co concentrations (µg/g dry wt) Control + Lakeside areaPolluted area Meat (muscle) 0.38 (0.23) n=4 - Meat (liver) 0.59 n=1 - Meat (kidney) 0.11 n=1 - Drinking water (µg/L) <0.001 n=4 0.012 (0.007) n=5 Indoor dust 11 (12) n=26 440 (600) n=33 Outdoor dust 11 (14) n=26 290 (360) n=33 Soil 20 (11) n=5 132 (185) n=21 Fish 0.34 (0.61) n=44 6.2 (12) n=54 -
 Control + Lakeside areaPolluted area Meat (muscle) 0.38 (0.23) n=4 - Meat (liver) 0.59 n=1 - Meat (kidney) 0.11 n=1 - Drinking water (µg/L) <0.001 n= (0.007) n=5 Indoor dust 11 (12) n= (600) n=33 Outdoor dust 11 (14) n= (360) n=33 Soil 20 (11) n=5 132 (185) n=21 Fish 0.34 (0.61) n= (12) n=54 -")
30
Location Adults (≥14 years) Children (<14 years) Control area KAMINA 6.0 (8.3) [n=13] 3.4 (1.5) [n=9] MISISI 2.3 (1.5) [n=7] 5.2 (3.4) [n=3] MBUJI MAYI 2.7 (2.2) [n=26] 4.2 (4.9) [n=6] SANDO 9.8 (9.3) [n=10] 8.2 (4.9) [n=7] Lakeside area KANSALABWE 15 (16) [n=25] 14 [n=1] KIBANGU 16 (14) [n=11] 21 (9.4) [n=6] SHINANGWA 12 (10) [n=11] 13 (9.7) [n=6] Polluted area KABECHA 16 (27) [n=17] 20 (17) [n=8] LIKASI PANDA 12 (8) [n=21] 13 (7.4) [n=7] LIKASI SHITURU 23 (22) [n=28] 56 (32) [n=9] SHAMITUMBA 25 (24) [n=13] 99 (120) [n=9] Urinary Co concentrations (µg/g creatinine)
![Location Adults (≥14 years) Children (<14 years) Control area KAMINA 6.0 (8.3) [n=13] 3.4 (1.5) [n=9] MISISI 2.3 (1.5) [n=7] 5.2 (3.4) [n=3] MBUJI MAYI 2.7 (2.2) [n=26] 4.2 (4.9) [n=6] SANDO 9.8 (9.3) [n=10] 8.2 (4.9) [n=7] Lakeside area KANSALABWE 15 (16) [n=25] 14 [n=1] KIBANGU 16 (14) [n=11] 21 (9.4) [n=6] SHINANGWA 12 (10) [n=11] 13 (9.7) [n=6] Polluted area KABECHA 16 (27) [n=17] 20 (17) [n=8] LIKASI PANDA 12 (8) [n=21] 13 (7.4) [n=7] LIKASI SHITURU 23 (22) [n=28] 56 (32) [n=9] SHAMITUMBA 25 (24) [n=13] 99 (120) [n=9] Urinary Co concentrations (µg/g creatinine)](http://images.slideplayer.com/24/7095431/slides/slide_30.jpg "Location Adults (≥14 years) Children (<14 years) Control area KAMINA 6.0 (8.3) [n=13] 3.4 (1.5) [n=9] MISISI 2.3 (1.5) [n=7] 5.2 (3.4) [n=3] MBUJI MAYI 2.7 (2.2) [n=26] 4.2 (4.9) [n=6] SANDO 9.8 (9.3) [n=10] 8.2 (4.9) [n=7] Lakeside area KANSALABWE 15 (16) [n=25] 14 [n=1] KIBANGU 16 (14) [n=11] 21 (9.4) [n=6] SHINANGWA 12 (10) [n=11] 13 (9.7) [n=6] Polluted area KABECHA 16 (27) [n=17] 20 (17) [n=8] LIKASI PANDA 12 (8) [n=21] 13 (7.4) [n=7] LIKASI SHITURU 23 (22) [n=28] 56 (32) [n=9] SHAMITUMBA 25 (24) [n=13] 99 (120) [n=9] Urinary Co concentrations (µg/g creatinine)")
31
Estimated Co intake (µg/day) – Adults 55 62 65 635509553593 9917079
 – Adults")
32
Adults

33
29 36 33 34 352416 340313 463437 Estimated Co intake (µg/day) – Children
 – Children")
34
Children

35
Conclusions Good (but not perfect) relation between estimated Co intake and urinary concentration of Co –Lower bioavailability of Co in dust? –Incorrect estimate of quantity of dust intake? Main contributory sources of Co: –Control areas: ~90% maize flour + vegetables –Lakeside areas: ~25% fish –Polluted areas: vegetables and dust (dust especially in children) Further analyses are planned for other metals
 Further analyses are planned for other metals.")
Similar presentations


 1, Mark J Nieuwenhuijsen (PhD) 2, Anna Hansell.>")
 Rosen Public.>")


