Download presentation
Presentation is loading. Please wait.

1
Excess risk of kidney disease mortality in a population living near industrial processes Susan Hodgson (MSc) 1, Mark J Nieuwenhuijsen (PhD) 2, Anna Hansell (Dr) 1, Sasha Shepperd (D.Phil) 1, Tracy Flute (BSc) 3, Brian Staples (Dr) 4, Paul Elliott (Prof) 1, Lars Jarup (PhD) 1 1 Small Area Health Statistics Unit (SAHSU), Imperial College London, UK. 2 Dept Environmental Science and Technology, Imperial College London, UK. 3 Warrington Primary Care Trust & Halton Primary Care Trust 4 Cheshire and Merseyside Health Protection Team, Central Liverpool Primary Care Trust

2
Introduction ‘Runcorn is exposed to the irritating vapours cast off so freely by the large chemical works in its vicinity’ Medical Officer of Health for Runcorn, Lancet, January 1880. Runcorn is still polluted by local industry, with substantial amounts of nephrotoxic chemicals (including lead, mercury, arsenic, chromium and solvents) being released annually. We undertook preliminary investigations into the health of the population living in the vicinity of industrial processes. The aim of this study was to determine if there was an excess risk of kidney mortality and morbidity in people living near the industrial processes.
 being released annually. We undertook preliminary investigations into the health of the population living in the vicinity of industrial processes. The aim of this study was to determine if there was an excess risk of kidney mortality and morbidity in people living near the industrial processes..")
3
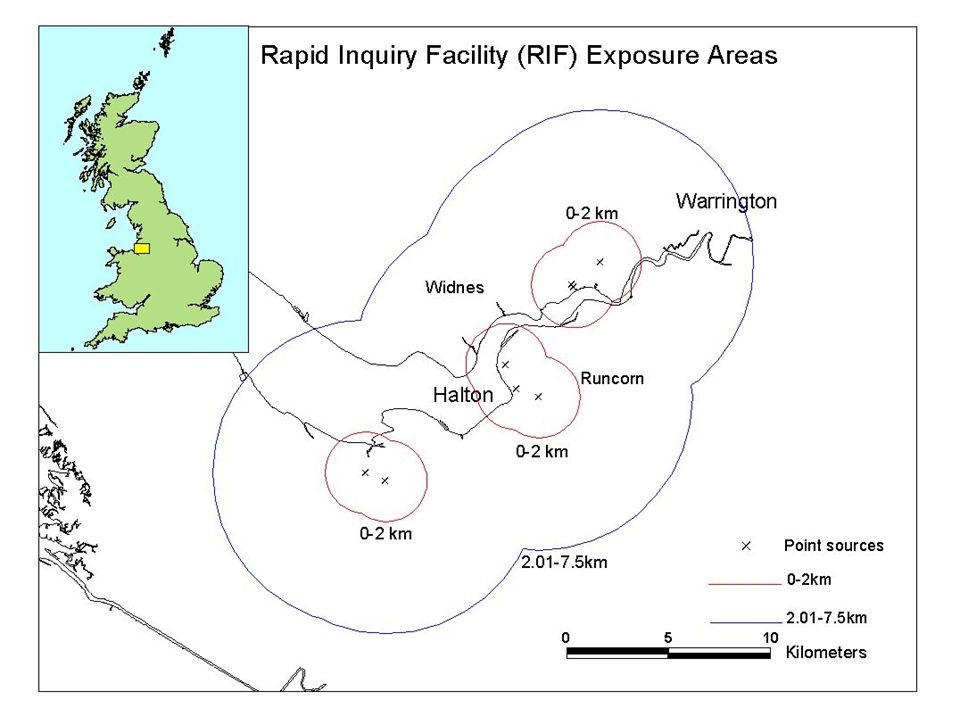
Methods – mortality analysis Mortality was investigated using routinely collected data supplied by the Office for National Statistics (ONS). Analysis was carried out using the SAHSU Rapid Inquiry Facility (RIF). Standardised Mortality Ratios (SMR) adjusted for socio-economic deprivation were calculated for deaths from nephritis, nephrotic syndrome and nephrosis (ICD9 580-589) over the years 1981-1999. Distance from industrial processes was used as a proxy for exposure - populations living within 0-2km and between 2.01-7.5km of 16 installations were investigated. Expected figures were derived from the North West region population.
. Standardised Mortality Ratios (SMR) adjusted for socio-economic deprivation were calculated for deaths from nephritis, nephrotic syndrome and nephrosis (ICD ) over the years Distance from industrial processes was used as a proxy for exposure - populations living within 0-2km and between km of 16 installations were investigated. Expected figures were derived from the North West region population..")
5
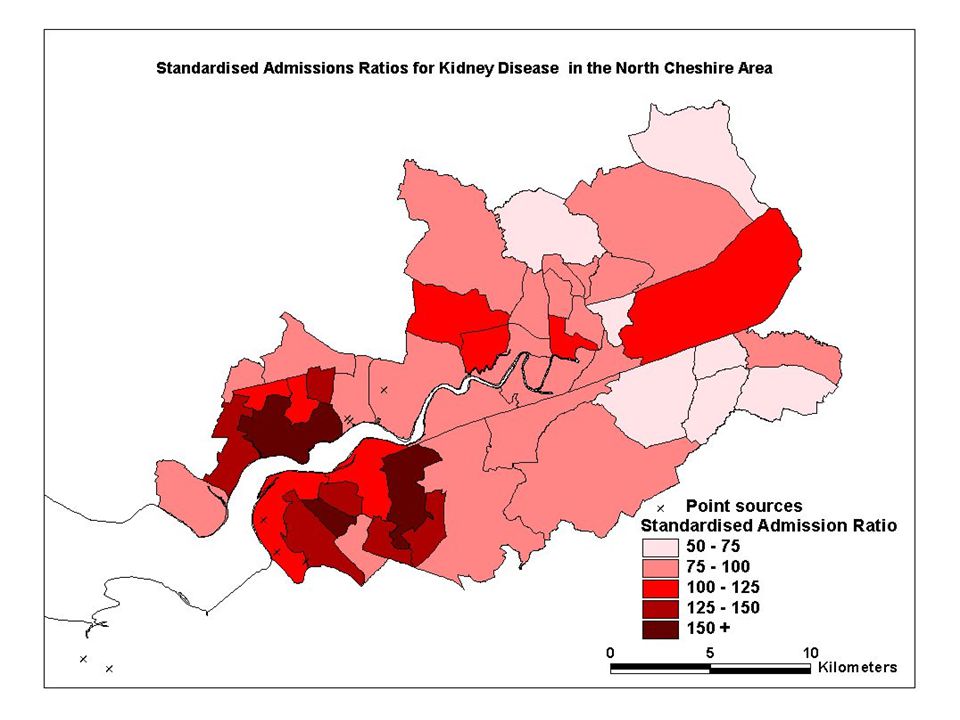
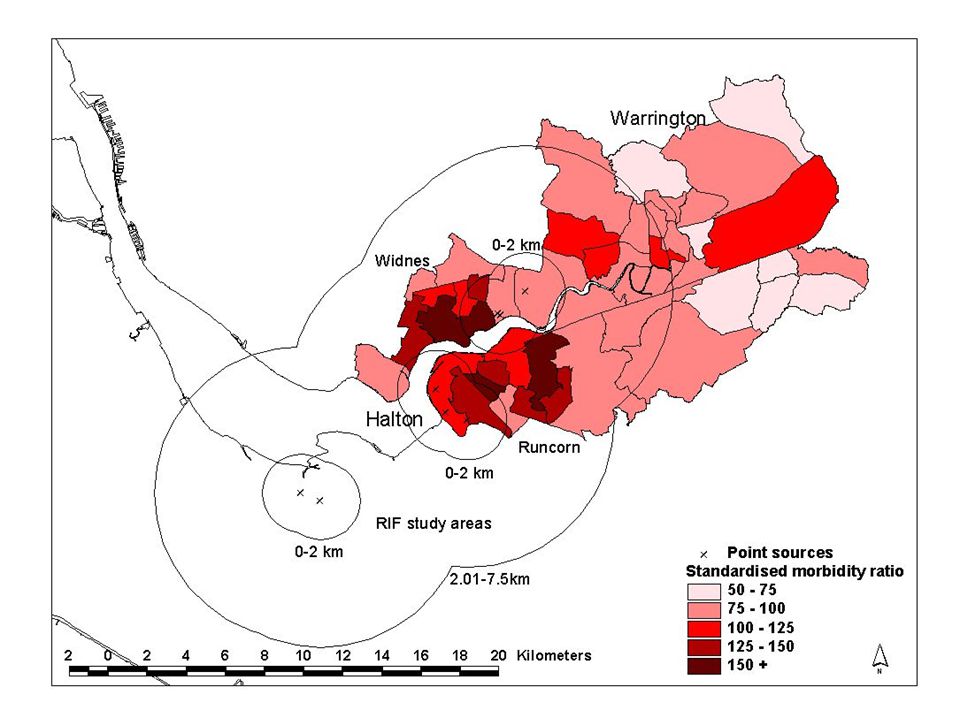
Methods – morbidity analysis Morbidity was assessed by the former North Cheshire Health Authority (NCHA). Kidney disease was mapped at electoral ward level using routinely collected local hospital admissions data (1990 to 1999). District age Standardised Admission Ratios (SAR) were calculated for non-malignant renal disease as well as kidney cancer (ICD9 580-583 (except 581.8, 582.8 and 583.8), 585-587, 189.0; ICD10 N00-N06, N10, N11.8, N11.9, N15.8, N18, N19, N26, C64). The population of Warrington and Halton was used as the reference.
. District age Standardised Admission Ratios (SAR) were calculated for non-malignant renal disease as well as kidney cancer (ICD (except 581.8, and 583.8), , 189.0; ICD10 N00-N06, N10, N11.8, N11.9, N15.8, N18, N19, N26, C64). The population of Warrington and Halton was used as the reference..")
6
Results Mortality study using RIF Distance SexObsExpSMR95% CI Unadjusted for deprivation 0-2 kmMale3223.8713492 - 189 Female4729.3160118 – 213 2.01-7.5 kmMale166152.0310994 - 127 Female206182.4711398 – 129 Adjusted for deprivation 0-2 kmMale3224.4113190 - 185 Female4729.18161118 - 214 2.01-7.5 kmMale166154.4110892 - 125 Female206185.9211197 – 127

8
Morbidity TownSexSAR95% CI RuncornMale 122 110-136 Female 136 122-151 WarringtonMale 91 85-97 Female 84 78-91

10
Discussion Significant excess of kidney mortality in people living nearest polluting sources Significant excess kidney morbidity in areas closest to the polluting sources Consistent pattern using two different methods and independent data sources Unlikely to be explained by occupation Further work is being being carried out to establish if the excess risks are causally related to chemical pollution in the area.

11
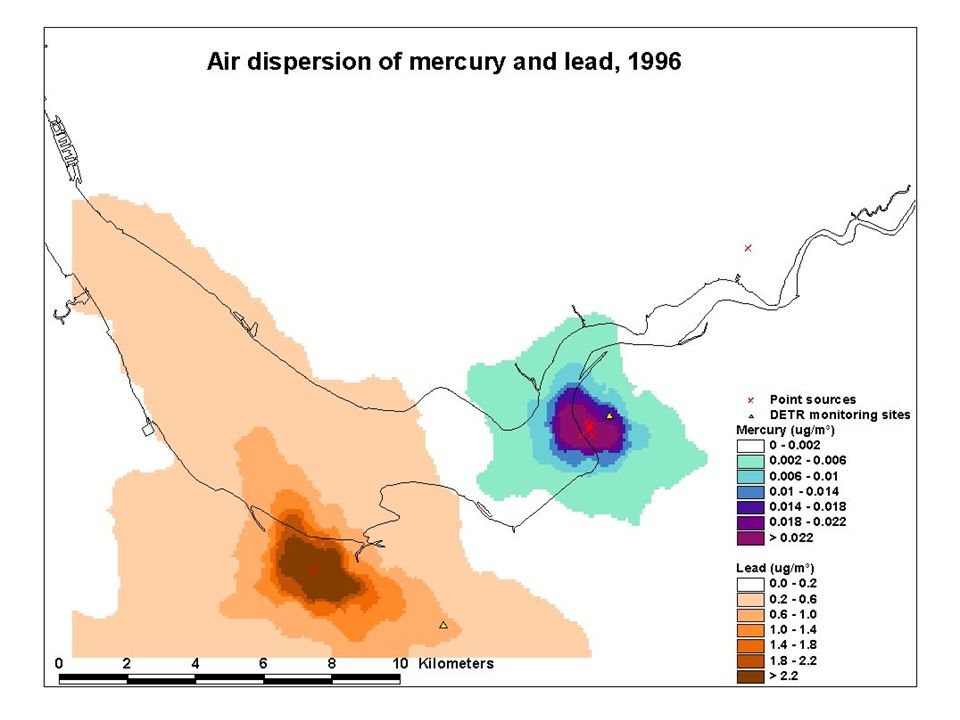
Ongoing work Exposure Assessment Air dispersion modelling of mercury and lead using ADMS-Urban (version 1.6) developed by CERC. This model will not provide a quantitative estimate of past exposures, but should indicate the extent of dispersion of mercury and lead, and highlight areas where exposure is significantly higher than the background levels experienced elsewhere in the UK

13
Modelled versus measured ambient mercury and lead levels, 2000 Ave measured value 0.022 g Hg/m 3 Ave modelled value 0.028 g Hg/m 3 Ave measured value 0.014 g Pb/m 3 Ave modelled value 0.008 g Pb/m 3

14
Model Validation Air monitoring will be carried out by the Environment Agency based on the model output. Urine samples will be collected from ~200 individuals. Mercury in urine will be determined by the HSL, Sheffield, using Inductively Coupled Plasma – Mass Spectrometry (ICP-MS). Health outcomes Further analysis of routine databases on mortality, cancer incidence and Hospital Episode Statistics. Individual level sub-study will assess the prevalence of early kidney damage using urinary biomarkers such as N-acetyl-β-glucosaminidase (NAG) and urinary β 2 -microglobulin.
. Health outcomes Further analysis of routine databases on mortality, cancer incidence and Hospital Episode Statistics. Individual level sub-study will assess the prevalence of early kidney damage using urinary biomarkers such as N-acetyl-β-glucosaminidase (NAG) and urinary β 2 -microglobulin..")
Similar presentations


 Occupational and Environmental.>")


 Yongtang Jin, MD, PhD, professor Dept of Environmental and Occupational Health,>")


 Helen Carter, NHS WM.>")


 &>")