Download presentation
Presentation is loading. Please wait.

1
Eligibility Decisions Within a Response to Intervention Framework Presented by: Robert Pasternack, Ph.D., Senior Vice President Cambium Learning Group Kim Gibbons, Ph.D., Executive Director St.Croix River Education District

2
Disability20042005200620072008 Mental retardation567,633546,030523,528497,480476,131 Hearing impairments72,59972,40772,78371,95670,781 Speech or language1,149,5731,156,9061,162,1441,151,8691,121,961 Visual impairments26,05826,02226,48126,36925,816 Emotional disturbance484,457472,470458,841439,684418,068 Orthopedic impairments65,35563,11962,00460,45462,371 OHI512,219561,618600,377630,689648,398 SLD2,839,2952,782,8372,711,8492,616,2972,525,898 Deaf-blindness1,7021,5881,4061,3801,745 Multiple disabilities133,366134,037133,810132,510124,073 Autism166,491193,840224,594258,017292,818 Traumatic brain injury23,26323,51523,77723,87124,866 Developmental delay74,36879,08283,99088,62996,923 Total6,116,3796,113,4716,085,5845,999,2055,889,849 Number of students with disabilities in U.S. and outlying areas, age 6-21

3
Overview of Session Describe the research base supporting the use of an RtI framework. Describe critical elements of the RtI framework used at the St. Croix River Education District. Share data documenting success of framework Describe how the framework is used to make entitlement decisions through the use of a case study.

4
Title 1 Services 16.5 Million Title 1 Services 16.5 Million Special Education Services 6.6 Million Special Education Services 6.6 Million English Language Services 3.9 Million English Language Services 3.9 Million U.S. Public School Enrollment & Special Services All Students 49.5 Million

7
Reschly SLD Identification Prevention of Special Education Presidents Commission (2002) Values and Outcomes: Efficacy of special education is not universally documentedlowered expectations, reduced academic pressure Later educational opportunities typically are better if learning and behavior problems can be resolved in early grades Probable later career opportunities are better if students can complete general education programs Prevention and early intervention enhance positive outcomes and expand educational and career opportunities
 Values and Outcomes: Efficacy of special education is not universally documentedlowered expectations, reduced academic pressure Later educational opportunities typically are better if learning and behavior problems can be resolved in early grades Probable later career opportunities are better if students can complete general education programs Prevention and early intervention enhance positive outcomes and expand educational and career opportunities")
8
High-quality instruction/intervention is defined as instruction or intervention, matched to student need, that has been demonstrated through scientific research and practice to produce high learning rates for most students Learning rate and level of performance are the primary sources of information used in ongoing decision-making. Important educational decisions about intensity and likely duration of interventions are based on individual student response to instruction across multiple tiers of intervention. Definition of Response to Intervention NASDSE, 2005

9
Response to Instruction (RTI) All Some Few
 All Some Few")
10
Most Intensive Students successful receiving intensive research-based services Response to Instruction (RTI) Students successfully receiving scientifically-based instruction
 Students successfully receiving scientifically-based instruction")
11
We can effectively teach all children Intervene early Use a multi-tier model of service delivery Use problem-solving method to make decisions within a multi-tier model Use research-based, scientifically validated interventions/ instruction to the extent available Monitor student progress to inform instruction Use data to make decisions. A data-based decision regarding student intervention is central to RtI practices Use assessment for three different purposes: screening applied to all children diagnostics Progress monitoring Core RtI Principles NASDSE, 2005

12
This is a process that will take time RtI is more about general education than special education RtI is a component of problem-solving, not an independent process Response-data based Intervention-evidence-based Strong basis in statute and rule

14
Changes in Legal Requirements IDEA (2004) (A) IN GENERAL.Notwithstanding section 607(b), when determining whether a child has a specific learning disability as defined in section 602, a local educational agency shall not be required to take into consideration whether a child has a severe discrepancy between achievement and intellectual ability in oral expression, listening comprehension, written expression, basic reading skill, reading comprehension, mathematical calculation, or mathematical reasoning. Reschly SLD Identification

15
Response to Intervention (IDEA, 2004) (B) ADDITIONAL AUTHORITY.In deter- mining whether a child has a specific learning disability, a local educational agency may use a process that determines if the child responds to scientific, research-based intervention as a part of the evaluation procedures described in paragraphs (2) and (3). Does response to intervention appear in the law? Reschly SLD Identification

16
Implementing 3 Tier models Tier 1: Enhanced Classroom instruction Tier 2: Typically small group pull out instruction, but can represent additional dose in the classroom Many approaches may work Progress monitoring essential in order to gauge level of intensity and adjust instructional emphasis

17
Basic Instructional Principles (Tiers I, II, and III) Instruction at the childs skill level Explicit, systematic, teacher directed, skills based Strong curriculum: scope and sequence defined; skill hierarchy Monitor progress, graph results in relation to goals Formative evaluation rules and instructional changes Reschly SLD Identification
 Instruction at the childs skill level Explicit, systematic, teacher directed, skills based Strong curriculum: scope and sequence defined; skill hierarchy Monitor progress, graph results in relation to goals Formative evaluation rules and instructional changes Reschly SLD Identification")
18
Reading Instruction Must be Integrated KG- G12 If a critical component is missing, students who at risk will not develop the component Success and failure in reading are opposite sides of the same coin- its the same theory, not two theories, one for success and another for failure Instruction is the key

19
Problem Analysis Validating Problem Ident Variables that Contribute to Problem Develop Plan Problem Analysis Validating Problem Ident Variables that Contribute to Problem Develop Plan Problem Solving Process Evaluate Response to Intervention (RtI) Evaluate Response to Intervention (RtI) Implement Plan Implement As Intended Progress Monitor Modify as Necessary Implement Plan Implement As Intended Progress Monitor Modify as Necessary
 Evaluate Response to Intervention (RtI) Implement Plan Implement As Intended Progress Monitor Modify as Necessary Implement Plan Implement As Intended Progress Monitor Modify as Necessary")
20
Why Problem-Solving ? BIG IDEAS AYP and Disaggregated Data (NCLB) move focus of attention to student progress, not student labels Building principals and superintendents want to know if students are achieving benchmarks, regardless of the students type Accurate placements do not guarantee that students will be exposed to interventions that maximize their rate of progress Effective interventions result from good problem-solving, rather than good testing Progress monitoring is done best with authentic assessment that is sensitive to small changes in student academic and social behavior
 move focus of attention to student progress, not student labels Building principals and superintendents want to know if students are achieving benchmarks, regardless of the students type Accurate placements do not guarantee that students will be exposed to interventions that maximize their rate of progress Effective interventions result from good problem-solving, rather than good testing Progress monitoring is done best with authentic assessment that is sensitive to small changes in student academic and social behavior.")
21
Application of Tier II Principles Focus on academics and behavior (e.g., point system for engagement, attention, task persistence, and gains) Monitor progress 1 or 2 Xs per week Graph progress against goals (benchmarks toward passing high stakes tests) Use normative and other data to determine expected rate of progress Reschly SLD Identification
 Monitor progress 1 or 2 Xs per week Graph progress against goals (benchmarks toward passing high stakes tests) Use normative and other data to determine expected rate of progress Reschly SLD Identification")
22
Tier II Academic Interventions (Vaughn et al., 2003 Exceptional Children) Goals: Move performance to benchmark trajectories and, If needed, consider more intensive interventions Example of Tier II academic intervention Small group, N=4-5, pull out, similar needs 30 to 35 minutes per day in addition to classroom instruction Progress monitoring weekly or semi-weekly Individual time series analysis graph 10 to 20 weeks of instruction 5-component reading interventions, with emphasis on weak components Reschly SLD Identification
 Goals: Move performance to benchmark trajectories and, If needed, consider more intensive interventions Example of Tier II academic intervention Small group, N=4-5, pull out, similar needs 30 to 35 minutes per day in addition to classroom instruction Progress monitoring weekly or semi-weekly Individual time series analysis graph 10 to 20 weeks of instruction 5-component reading interventions, with emphasis on weak components Reschly SLD Identification")
23
Standard Protocol Reading Models for Tier II http://www.texasreading.org/utcrla/ U Texas,Vaughn http://www.texasreading.org/utcrla/ http://www.fcrr.org/ Florida State Torgesen http://www.fcrr.org/ Reading five domains taught each day Direct instruction Weekly progress monitoring Individual graphs, progress against goals referenced to benchmarks Decisions determined by student response Fade Tier II and return to general education Consider Tier III based on insufficient response

24
Direct, Explicit, Systematic, Teacher-Directed Varies with student prior learning Explicit instruction (Vaughn & Linan-Thompson) provide clear instructions and modeling include multiple examples ( & non-examples when appropriate) Systematic instruction (Vaughn & Linan-Thompson) break tasks into sequential, manageable steps progress from simple to more complex concepts and skills ensure students have prerequisite knowledge & skills Reschly SLD Identification
 provide clear instructions and modeling include multiple examples ( & non-examples when appropriate) Systematic instruction (Vaughn & Linan-Thompson) break tasks into sequential, manageable steps progress from simple to more complex concepts and skills ensure students have prerequisite knowledge & skills Reschly SLD Identification")
25
Direct, Explicit, Systematic Teacher-Directed Instruction, cont. Teach all elements of the task Break task into componentsas far as needed How explicit? Explicit enough for the student to make good progress Teacher Models Skill, using multiple examples and non-examples Teacher and student perform task together Student performs task with feedback Student independently practices task to automaticity Integrate skills with prior skills and competencies Reschly SLD Identification

26
Ample practice opportunities (Vaughn & LinanThompson) provide multiple opportunities for students to respond and demonstrate their learning provide sufficient guided and independent practice Immediate, specific feedback (Vaughn & Linan-Thompson) provide positive reinforcement and elaboration correct errors and provide clarification to prevent students from practicing misconceptions Direct, Explicit, Systematic Teacher-Directed Instruction, cont. Reschly SLD Identification

27
Effective Features of Instruction Targeted and explicit step-by-step lessons Conspicuous strategies Scaffolded support model Active student engagement and participation Ample, multiple practice opportunities

28
Effective Features of Instruction Frequent, immediate feedback with additional opportunities to respond – specific error corrections Continual and judicious review Focus on skills struggling readers lack; teach less more thoroughly Integrated assessment Strategic integration of the five essential components of reading

29
Whats Happening in the Brain?

31
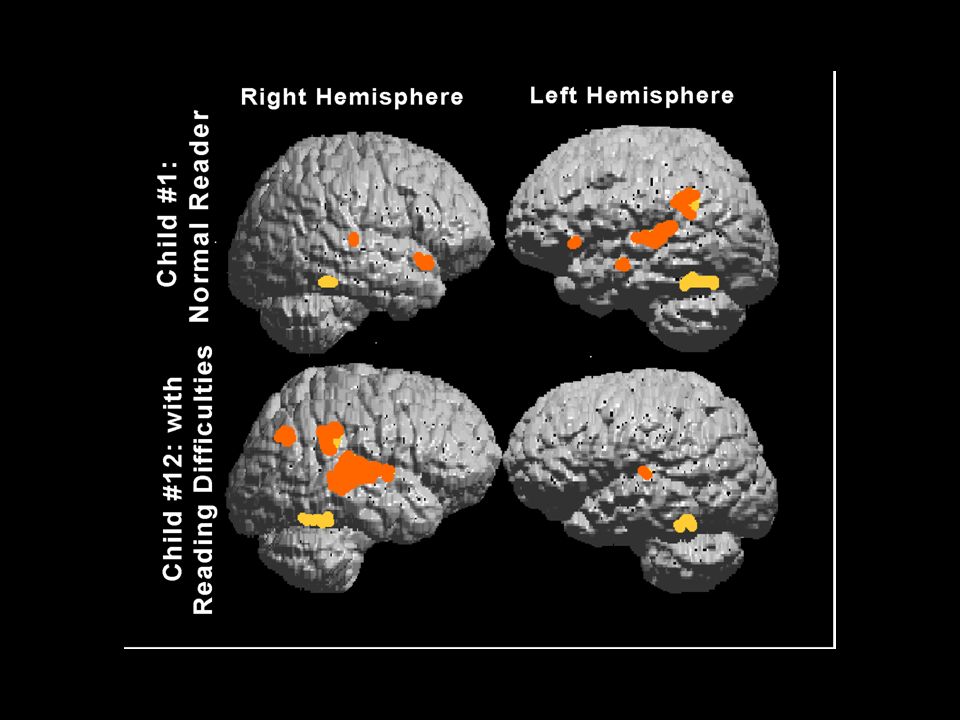
Left Hemisphere Right Hemisphere Child 2 w/ Reading Difficulties Child 1 Normal Reader

34
Low Risk S1 High Risk- Responder S8 High Risk- Non Responder S31

35
The Big Ideas of Intervention Supplement students receive intervention in addition to core reading instruction Intensify achieved through more time on task, smaller group size, or both Differentiate accomplished through choice of materials, entry points, deliberate instruction, and reteaching Accelerate - progress to make up losses

36
What Are Interventions? Targeted assistance based on progress monitoring Administered by teacher or specialist Provided additional instruction (individual or small group) Match materials to instructional level Modify modes of task presentation Modify instructional time Increase task structure Increase task relevant practice J. McCook LRP Conference December 2005
 Match materials to instructional level Modify modes of task presentation Modify instructional time Increase task structure Increase task relevant practice J. McCook LRP Conference December")
37
Mini-lesson on skills deficits Decrease group size Increase amount and type of cues and prompts Teach additional strategies Change curriculum Change types and method of corrective feedback J. McCook LRP Conference December 2005 What Are Interventions?

38
What Interventions are Not… Preferential seating Shortened assignments Parent contacts Classroom observations Suspension Doing more of the same assignments Retentions J. McCook LRP Conference December 2005

39
Small Groups Coherent and consistent instructional routine Targeted and explicit step-by-step lessons Intense and deliberate direct instruction Teacher Modeling Active Student engagement and participation Ample, multiple practice opportunities Frequent, immediate feedback with additional opportunities to respond- specific error corrections Continual and sufficient review Focus on skills struggling readers lack Effective Features of Instruction

40
Response to Intervention at the St. Croix River Education District (SCRED)
")
41
Background St. Croix River Education District has six member districts. Total population is approximately 14,000 students. Special Education child count is 1100 SCRED was the first district to pilot Curriculum Based Measures (CBM) in 1979 when they were being field-tested. Long history of over 30 years of data-based decision making.
 in 1979 when they were being field-tested. Long history of over 30 years of data-based decision making..")
42
St. Croix River Education District (SCRED) members: East Central Hinckley-Finlayson Pine City Rush City Chisago Lakes
 members: East Central Hinckley-Finlayson Pine City Rush City Chisago Lakes.")
43
Problem-Solving & Organization Assessment Instruction SCRED RtI Model: Academics & Positive Behavior Support Tier 1: Universal 75-80% Tier 2: Strategic 15-20% Tier 3: Intensive 5-10%

44
A few tips from Jim Ysseldyke We need to move from sifting and sorting to multi-tiered serving. We need to shift our focus from struggling students to making sure all students struggle. The best place to start correcting learning problems is in the instructional process. Keep our focus on assessment practices that matter! Focus on Alterable Variables

45
If the water in the aquarium is dirty, dont spend time diagnosing individual fish. Students dont learn in a vacuum. They function in environments that include curriculum, specific instructional strategies, peers, and school organizations. Credit to Amelia VonName Larsen for this quote.

46
The Water… I C E L O

47
I Instruction Standards-Driven Learning Units, High-Quality Lesson Plans (Acquisition, Extending/Refining, Acceleration, Differentiation, Review); Research-Based Instructional Practices (i.e., previewing, explicit instructional skill/strategy, modeling, scaffolding, graphic organizers, summarizing), Student Movement (Grouping strategies, levels of support (instructional time, content, level, intensity) … C Curriculum Standards-Based (Benchmarks), Scientifically validated programs, Prioritized Maps, Alignment, Relevance, Rigor, Connections/Integration, Resources/Materials … E Environment Resource Rich Environments (i.e., materials, word walls, student work displayed); Peers (Expectations, Reinforcement, Values, Support); Classroom (Rules, Distractions, Seating, Schedule, Physical Plant), Home/Family Support, Culture, Climate L Learner Skills, Strategies, Motivation, Health, Family, Social/Emotional, Development, Engagement, Executive Functioning, Efficacy … O Organization Resource Allocation, Scheduling, Systems, Structure, Management, Planning, Job Embedded Professional Development, Continuum of Services, Movement of Students, Instructional Time, Procedures … Water Domains
; Research-Based Instructional Practices (i.e., previewing, explicit instructional skill/strategy, modeling, scaffolding, graphic organizers, summarizing), Student Movement (Grouping strategies, levels of support (instructional time, content, level, intensity) … C Curriculum Standards-Based (Benchmarks), Scientifically validated programs, Prioritized Maps, Alignment, Relevance, Rigor, Connections/Integration, Resources/Materials … E Environment Resource Rich Environments (i.e., materials, word walls, student work displayed); Peers (Expectations, Reinforcement, Values, Support); Classroom (Rules, Distractions, Seating, Schedule, Physical Plant), Home/Family Support, Culture, Climate L Learner Skills, Strategies, Motivation, Health, Family, Social/Emotional, Development, Engagement, Executive Functioning, Efficacy … O Organization Resource Allocation, Scheduling, Systems, Structure, Management, Planning, Job Embedded Professional Development, Continuum of Services, Movement of Students, Instructional Time, Procedures … Water Domains")
48
The question needs to change! Shift the question we are asking from: What about the student is causing the performance discrepancy? to What about the instruction, curriculum, & environment should be altered so that students will learn and be more successful?

49
Guiding Questions for RtI Implementation 1.Is the core program sufficient? 2.If the core program is not sufficient, why isnt it? 3.How will the needs identified in the core be addressed? 4.How will the effectiveness and efficiency of the core be monitored over time? 5.Have improvement to the core been effective? 6.For which students is the core program sufficient and not sufficient and why? 7.What specific supplemental and intensive instruction is needed? 8.How will supplemental and intensive instruction be delivered? 9.How will effectiveness of supplemental and intensive instruction be monitored? 10.Which students need to move to a different level of instruction? Sharon Kurns, Heartland AEA #11

50
Establishing a Measurement System Core feature of RTI is identifying a measurement system – Screen large numbers of students – Identify students in need of additional intervention – Monitor students of concern more frequently Monthly Weekly

51
____________________________________ valid reliable simple quick inexpensive easily understood can be given often sensitive to growth over short periods of time Characteristics of An Effective Measurement System

52
Screening Measures used at SCRED The Aimsweb program is used to manage data

53
Correlations with High-Stakes Tests Letter sound fluency (Fall of K) to Oral Reading Fluency (Spring Gr.1) is.64** Oral Reading Fluency to MCA-II ranges from.50** (grade 8) to.79** Math Applications to MCA-II ranges from.51** to.79** MAP Reading to MCA-II ranges from.72** -.78** MAP Math to MCA-II ranges from.73**-.86**
 to Oral Reading Fluency (Spring Gr.1) is.64** Oral Reading Fluency to MCA-II ranges from.50** (grade 8) to.79** Math Applications to MCA-II ranges from.51** to.79** MAP Reading to MCA-II ranges from.72** -.78** MAP Math to MCA-II ranges from.73**-.86**")
54
Development of Target Scores Logistical regression procedures used to predict performance on MCA-II Tier 1 and Tier 2 Targets Developed

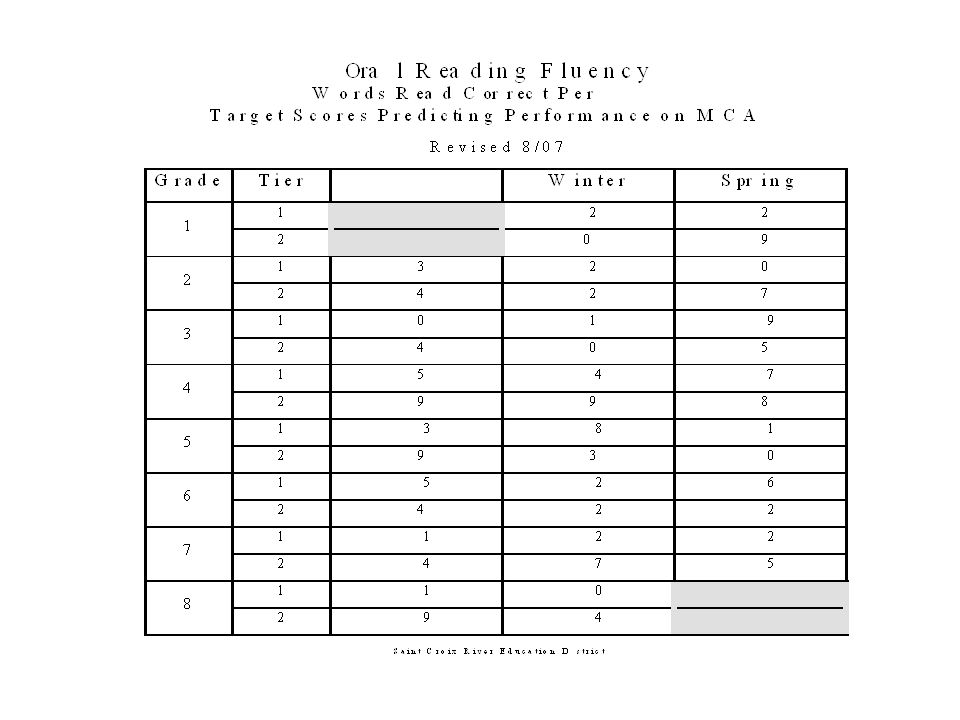
60
Progress Monitoring Measures used at SCRED All GOMs are used through Grade 12 for students who are below target.

61
Lesson Learned Regarding Measurement Measurement System Needs to: – Benchmark progress for ALL students three times per year. – Progress monitor at-risk students frequently. – Inform instruction! – Ideally be the same system across all three tiers of instruction Training on how to collect data is not enough. User friendly data reports are essential! Use data both at the individual student level and at the system level to judge progress!

62
Problem-Solving & Organization Assessment Instruction SCRED RtI Model: Academics & Positive Behavior Support Tier 1: Universal 75-80% Tier 2: Strategic 15-20% Tier 3: Intensive 5-10%

63
Instruction In an RTI model, it is imperative to have a high- quality, research-based curriculum in place that meets the needs of most students (~80%) You dont want to have large numbers of students referred for problem solving (or special education) due to an inadequate curriculum! Emphasis on a 3-Tier Model

64
If All You Have is a Hammer, Everything Starts to Look Like a Nail

65
If All a Teacher Has for Support for Students with Academic and/or Behavioral Needs is Special Ed Every Student with Academic and/or Behavioral Needs Will Look Like a.......

66
Bridging the Gap Core + Intensive Core Weekly-Monthly Core + Supplemental 3x/year Weekly Amount of Resources Needed To Benefit Severity of Educational Need or Problem

67
Successful Multi-Tier Models Have: A continuum of services and/or programs across the tiers that are scientifically based Methods of evaluating and monitoring progress across the tiers, ideally those that are considered scientifically based Efficient, COMMON methods of communicating student performance for all disciplines.

68
Tier 1 is Delivery of a Scientifically Based Core Program with... Fidelity Intensity Passion Reasonable Accommodations If Done Well, We Expect to Meet the Needs of Most...Some Will Need More

69
Tier 2 is MORE (More) Time (More) Explicit Teacher-Led Instruction (More) Scaffolded Instruction (More) Opportunities to Respond with Corrective Feedback (More) Language Support, Especially Vocabulary (More) Intensive Motivational Strategies (More) Frequent Progress Monitoring
 Time (More) Explicit Teacher-Led Instruction (More) Scaffolded Instruction (More) Opportunities to Respond with Corrective Feedback (More) Language Support, Especially Vocabulary (More) Intensive Motivational Strategies (More) Frequent Progress Monitoring")
70
Tier 3 is MOST (Most) Time (Most) Explicit Teacher-Led Instruction (Most) Scaffolded Instruction (Most) Opportunities to Respond with Corrective Feedback (Most) Language Support, Especially Vocabulary (Most) Intensive Motivational Strategies (Most) Frequent Progress Monitoring
 Time (Most) Explicit Teacher-Led Instruction (Most) Scaffolded Instruction (Most) Opportunities to Respond with Corrective Feedback (Most) Language Support, Especially Vocabulary (Most) Intensive Motivational Strategies (Most) Frequent Progress Monitoring")
71
Select Set of Standard Interventions Matched to Student Need Reading – Reading Mastery – Corrective Reading – Journeys (Voyager) – Read Naturally – Headsprout – Fluency Protocols Math – Vmath (Voyager) – Odyssey – Study Island – Tools for Success SCRED Examples Behavior – Check and Connect – Social Skill groups
 – Read Naturally – Headsprout – Fluency Protocols Math – Vmath (Voyager) – Odyssey – Study Island – Tools for Success SCRED Examples Behavior – Check and Connect – Social Skill groups")
72
Lesson Learned: A Multi-Tiered Service Delivery Model is Critical Efficient use of resources Teaming Instructional Time can be Problematic

73
Problem Solving Process and School-Wide Organization Once a measurement system and research-based curriculum are in place, schools must have a problem solving system to meet the needs of unique learners. Problem Solving Teams must have a process to use to develop interventions for at-risk students. Buildings must be organized to support problem solving

74
Five building-level supporting structures promote Problem Solving and optimal student achievement: Continuous Measurement Grade-level Team Meetings Flexible Grouping Grade-level Scheduling Concentrated Resources ____________________________________ Organization: Supporting Structures

75
FallWinterSpring Intensive Strategic Benchmark Strategic Target: Total ____ Enrollment: Grade: Goal:

76
FallWinter Spring Bobby 21-67 Woody 16-63 Edward 15-58 Truman 24-57 James 10-53 Intensive <26 17 students 25% Intensive <26 17 students 25% Intensive 10 students 15% Intensive 10 students 15% Intensive Strategic Isis 30-86 Johanna 35-85 A.S. Marie 31-76 Peggy D 33-73 Benchmark 45 students 05-06 66% 04-05 61% 03-04 56% Benchmark 45 students 05-06 66% 04-05 61% 03-04 56% Benchmark 47 students 05-06 70% 04-05 69% 03-04 61% Benchmark 47 students 05-06 70% 04-05 69% 03-04 61% Benchmark 05-06 04-05 68% 03-04 54% Benchmark 05-06 04-05 68% 03-04 54% Strategic =26 6 students 9% Strategic =26 6 students 9% Strategic 10 students 15% Strategic 10 students 15% Target: 43 72 90 Total 68 67 Enrollment: 2nd grade 42 Peggy N 43-71 Tom T 65-70 Goal 70% 2 10

77
Sample Summary of Effectiveness Chart Developed by Dr. Barb Scierka, SCRED

78
Summary of Effectiveness Data Goals % Students Fall Gr.2 % Students Spring Gr.2 % Students Fall Gr.3 % Students Spring Gr.3 80%Tier 156%74%69% 15%Tier 225%19%20% 5%Tier 319%7%11% % Maintained Fall- Spring Gr.2 94% (95% is goal)
")
79
Schools Use CBM in Universal Screening Instead of Referral Driven Practices < 25th Tier 2 Candidates <10th Individual Problem Solving and/or Tier 3 Candidates

80
Steps of Problem-Solving 1. Problem Identification What is the discrepancy between what is expected and what is occurring? 2. Problem Analysis Why is the problem occurring? 3. Plan Development What is the goal? What is the intervention plan to address this goal? How will progress be monitored? 4. Plan Implementation How will implementation integrity be ensured? 5. Plan Evaluation Is the intervention plan effective?

81
Problem Identification Identified problems are specifically defined in observable measurable terms Technically adequate measurement systems are used to describe the behavior that is occurring and the behavior that is expected Team prioritizes and considers one problem at a time

82
Problem Analysis Efforts are made to assess why the problem is occurring Teams focus on those possible causes to the behavior that can be affected through school resources – Curriculum, Instruction, Environment

83
Plan Development Observable measurable goals are written for each problem to be addressed – Often end of year grade level goals Interventions are research supported Progress monitoring data is collected and graphed for every goal

84
Plan Implementation Intervention plans are explicitly documented Intervention integrity is assured through direct observation – Intervention is delivered as planned Document level to which student participated in intervention – Attendance, time, active engagement

85
Plan Evaluation Student progress is evaluated based on data Records maintained on cases completed – Success rate, grade level or problem type most often referred Ongoing team Functioning is considered – Efficiency of team meetings, quality of communication

86
Effectiveness of RtI at the St. Croix River Education District

91
Eligibility

92
History MN has had criteria requiring severe IQ/ACH discrepancy, information processing deficits, and severe low achievement. SCRED abandoned MN criteria after IDEA 2004 was passed saying that states can t mandate the use of a SD model. Workgroup was established in 2002 to develop our eligibility criteria.

93
Millionaire Questions Addressed by Workgroup What are the steps of our eligibility model? Are we going to us the problem solving model, standard treatment protocol, or both? How is generally effective instruction by the classroom teacher defined? How we will define dually discrepant (level and slope)? What are the decision-making cut points? What is the reference group for demarcating responsiveness? National, state, or local norms? How long should students remain in an intervention phase? What is the criteria for exiting students from special education? When should due process be initiated? What data should be collected to determine the effect of using a different criteria? SCRED SLD Guideline is available for download at www.scred.k12.mn.us
. What are the decision-making cut points. What is the reference group for demarcating responsiveness. National, state, or local norms. How long should students remain in an intervention phase. What is the criteria for exiting students from special education. When should due process be initiated. What data should be collected to determine the effect of using a different criteria. SCRED SLD Guideline is available for download at")
94
SCRED Criteria 1.Level of achievement is significantly discrepant from local expectations: 7 th percentile guideline initially established 5th percentile after state rules developed 2.Rate of progress (slope) is significantly discrepant from target expectations. Slope is below a 95% confidence interval around the target slope 3.Verification that the problem solving process was followed with integrity. 4.Verification that the student demonstrates educational needs that require special education services to be appropriately met. 5.Information Processing (state criteria)
.")
95
MN 3525.1341 Specific Learning Disability Districts can choose between severe discrepancy model or RtI approach. RtI Approach: – Rate of Progress (slope) Minimum of 12 data points (MN Rule 3525.1341 (2) (D). – Level of Achievement 5th percentile (MN Rule 3525.1341(2)(D)(4)) Valid and reliable achievement measures Compared to state or national norms Local comparison may also be used
 Minimum of 12 data points (MN Rule (2) (D). – Level of Achievement 5th percentile (MN Rule (2)(D)(4)) Valid and reliable achievement measures Compared to state or national norms Local comparison may also be used.")
96
MN Rules 3525.1341 Specific Learning Disability In addition: - Underachievement - Information Processing - Exclusionary Factors

97
Case Study: Billy 8th grade Problem Identification Record Review Interview teacher, parent, and student Observation Testing Discrepancy Statement: Billy is reading 52 words correct per minute with 2 errors on eighth grade level reading passages. The target for 8th grade students in the spring is 170 WCPM.

98
Case Study Problem Analysis Data from a variety of sources (RIOT) and domains (ICEL) were collected to consider multiple hypotheses for the cause of the discrepancy.
 and domains (ICEL) were collected to consider multiple hypotheses for the cause of the discrepancy.")
99
Case Study Converging data support the chosen hypothesis: Billy is reading 52 words correct per minute with 2 errors on eighth grade level reading passages while same grade peers are expected to read 170 WCPM because Billy needs more practice to increase his reading fluency.

100
Case Study Plan Development 1.Goal: By May 2005, Billy will read 113 words correct per minute with 0 errors from Grade 8 R-CBM passages. The rate of improvement should be 1.2 words correct per week. 2.Instructional Plan: Billy will participate in the Six Minute Solution reading intervention being implemented by Mr. Teacher in addition to his current reading program.

101
Case Study 2. Materials Needed: Aimsweb Grade 7 Reading passages, timer, colored pencils, graph 3. Measurement System: R-CBM collected weekly by a resource room paraprofessional on Tuesdays. - Grade 8 reading passages for progress monitoring.

102
Case Study Plan Implementation – The school psychologist observed Mr. Teacher implement the Six Minute Solution. A script was used for training the teacher, and this same script was used during the observation. – The observation indicated that the intervention was implemented correctly. – Data were collected and graphed as stated in the plan.

104
Case Study Plan Evaluation – The intervention was implemented with fidelity. – Pre-intervention discrepancy stayed the same. – Team went through problem-solving steps again.

105
Case Study 1. Problem Identification Discrepancy Statement: Billy is reading 58 words correct per minute with 2 errors on eighth grade level reading passages. The target for Grade 8 is 170 WCPM with an expected growth rate of 1.2 words per week.

106
2. Problem Analysis RIOT/ICEL Hypothesis: Billy is reading 58 words correct per minute with 2 errors on eighth grade level reading passages while same grade peers are expected to read is 170 WCPM because Billy needs more instructional time to increase his reading fluency.

107
Case Study 3. Plan Development Small group reading using Corrective Reading, Level B Curriculum with reading teacher daily for 50 minutes in addition to core reading class.

111
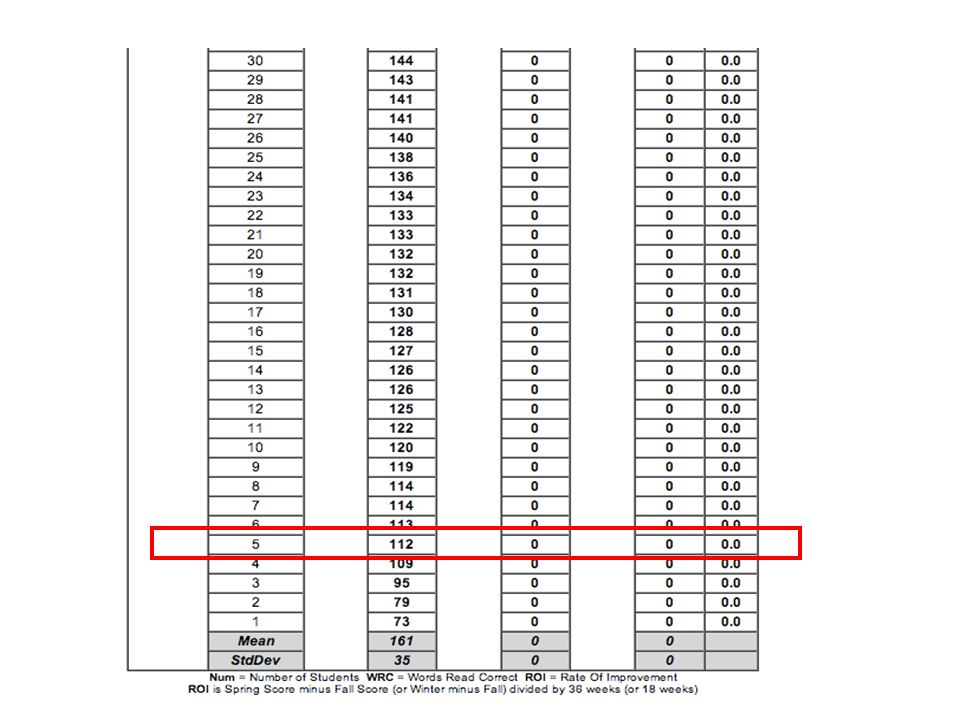
Case Study: Entitlement Decision Students slope is -.4 words per week – Bottom of confidence interval for Grade 8 is.28. Students level is 52. – 5th percentile score is 112 based on district local norms.

112
Case Study Case Review Protocol indicates problem solving process was used with fidelity. Team verified information processing concerns. Team addressed exclusionary factors Team Verified high degree of instructional need that must be addressed through SE services. Team concludes student is eligible for special education services.

113
Lesson Learned: Intervention Integrity is a Hot Issue that Should Not be Ignored! Critical to evaluate whether intervention was implemented as designed. Supportive vs.. Evaluative Who conducts integrity checks?

114
Lesson Learned: Documentation of Process is Critical Must have a clearly defined process Forms and guidelines to guide process Start out with tight reigns – SCRED oversight of referrals – Problems with documentation

115
Lesson Learned: Ongoing Training and Support is Critical! Problem Solving Team Training RtI Users Forum Expert troubleshooter Grade Level Teams – Use of data to make decisions – Interventions

116
Lesson Learned: Teach Patience and Flexibility RtI implementation is a work in progress – Modify and adjust as necessary – Work together to implement the process and address questions – Answer questions from field but obtain input (RtI user forum, FAQ) – Emphasize that you might be working in the grey zone at times, but the process works for kids!
 – Emphasize that you might be working in the grey zone at times, but the process works for kids!")
117
Lesson Learned: Expect Questions and Occasional Conflict Top Questions: – What is the role of the special education teacher in the RtI process? – Who verifies the integrity of interventions? – How do we determine when an intervention is rigorous enough? – What are scientific, research-based interventions Developed a FAQ sheet.

118
Additional Resources Burns, M. & Gibbons, K. (2008) Implementing Response to Intervention in Primary and Secondary Schools: Procedures to Assure Scientific-Based Practices. Routledge: NY. (Amazon.com)
 Implementing Response to Intervention in Primary and Secondary Schools: Procedures to Assure Scientific-Based Practices. Routledge: NY. (Amazon.com).")
119
Problem Solving Training RtI Summer Institute June 21-23 2010 in Bloomington,MN www.kimgibbons.org to download flyer www.kimgibbons.org

120
Questions? Kim Gibbons – kgibbons@scred.k12.mn.us kgibbons@scred.k12.mn.us – 320-358-1214 SCRED Website (for forms, etc.) www.scred.k12.mn.us
")
Similar presentations


 & The IST Process>")


 Progress Monitoring Interventions Tiers Training/Materials Problem Solving Model Allocation of Resources.>")


 in Primary Grades>")


