Download presentation
Presentation is loading. Please wait.

1
Beef Evaluation and Pricing continued

2
Estimating Yield Grade Visually evaluate animal for differences in fat and muscle Shape

3
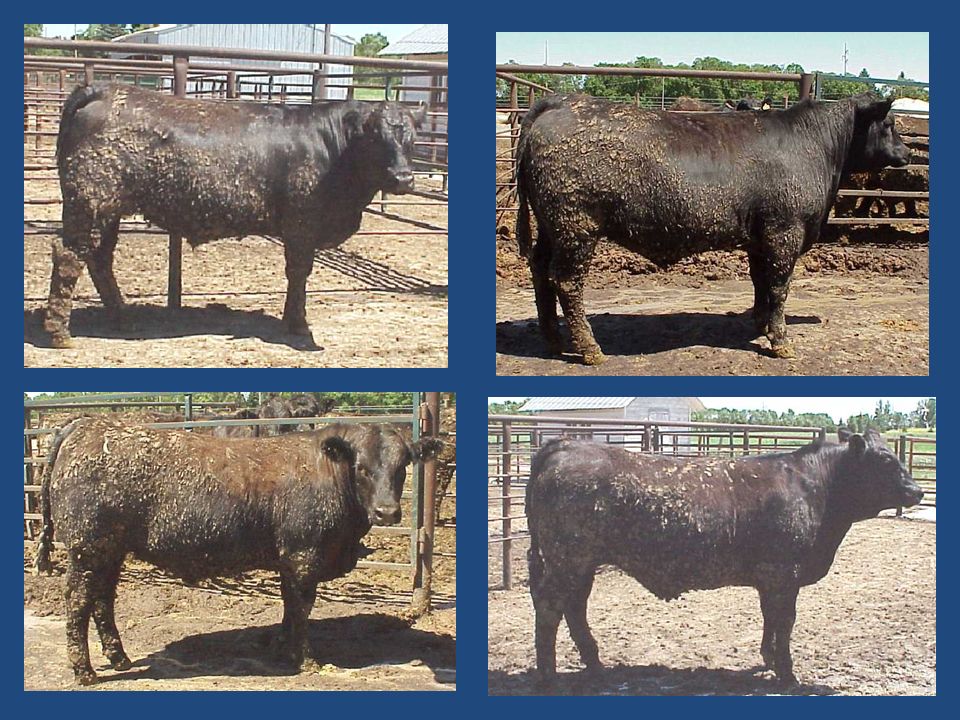
Visual Indicators of Finish

5
x x

6
1100 lbs1030 lbs

7
Visual Indicators of Finish

15
BF.70 REA13.5 YG3.3 BF1.50 REA10.6 YG6.0

16
Visual Indicators of Finish

17
Practice Comparisons Heifer – 1365 lbs

18
Practice Comparisons Steer – 1350 lbs

19
Practice Comparisons Heifer – 1365 lbs DP % - 60.6 HCW- 828 Back fat -.90” (PYG 4.3) RREA – 13.7 AREA - 10.8 (add.9) KPH fat – 3.5% (no adjustment) Final Y.G. 5.2

20
Practice Comparisons Steer – 1350 lbs DP %- 64.0 HCW- 864 Back fat -.30” (PYG 2.7) RREA – 14.2 AREA – 16.2 (subtract.6) KPH fat – 2.5% (subtract.2) Final Y.G. 1.9

21
What is in a pen of cattle?

23
How Much Variation Really Exists? 95 NBQA Mean STD HCW 759 94 Fat.6.24 REA 12.9 1.6 YG 3.16.91 Marb 525 106

24
1 SD = 68%, 2 SD = 95 %, 3 SD = 99% mean From D. M. Marshall

27
Frame Size

28
How Much Variation Really Exists? Blacks Colored MeanSTDMean STD HCW738 743 Fat.59.59 REA12.612.7 YG 3.23.3 Marb560539

29
How Much Variation Really Exists? Blacks Colored MeanSTDMean STD HCW7386674368 Fat.59.15.59.14 REA12.61.012.71.2 YG 3.2.63.3.6 Marb5608753978

30
How Much Variation Really Exists? Blacks Colored MeanSTDMean STD HCW7386674368 Fat.59.15.59.14 REA12.61.012.71.2 YG 3.2.63.3.6 Marb5608753978 OutlinersNo.%No.% - YG 4’s 106.0 64.0 - Weight 0 0 21.3 Total 106.0 85.0

31
Fitting Cattle to a Grid

32
Grid 1Grid 2P & D Base112117112 Prime+11.00+3.005.5 Premium Ch+10.00-2.58 Choice--- Select-7.00-11.00-8.25 Standard-28.00-30.00-18.25 YG 1+6.50+2.00+2.42 YG 2+2.50+3.00+1.00 YG 3--- YG 4-12.00-12.00-15.67 YG 4-11.00-12.00

33
Mean N =164 Live1203 HCW770 BF.51 REA12.35 YG3.2 MarbSm 40 % Choice64% % YG 1,2’s37% Outliers # hd1

34
MeanBreed ABreed B N =1598070 Live12031183 a 1230 b HCW770754 a 790 b BF.51.54 a.47 b REA12.3512.0 a 12.8 b YG3.23.3 a 3.0 b

35
MeanBreed ABreed B N =1598070 Live120311831230 HCW770754790 BF.51.54.47 REA12.3512.012.8 YG3.23.33.0 MarbSm 40 Sm 60 a Sm 10 b % Choice64%82%41.4% % YG 1,2’s37%31.5%44.3% Outliers # hd11 std0

36
Grid 1Grid 2P & D All113.68113.61110.49

37
Grid 1Grid 2P & D All113.68113.61110.49 Breed A115.23115.64112.02 Breed B111.70111.03108.54

38
HCW$/cwtValue All770113.68875.15 Breed A754115.23869.36 Breed B790111.70882.52 Value - $/hd Priced on the Same Grid

40
Questions to Ask Do my cattle fit what the “grid”or program is asking for? What are the costs? How much useful data do I receive?

41
The Future of Markets Advanced technology Grid Pricing, alliances, cooperatives will increase. Negotiation of cattle terms of trade will increase significantly. *Wayne Purcell, 1997

42
The Future of Cattle Evaluation

44
Ultrand Non-Conf Rail Non-Conf 16 65145 157211229 271279 349 377 6 hd = 10% of pop. 434 449 458 465 466 467 468 470 482 501 518 528 915 21 hd or 34% of pop.

45
Cattle Marketing: 65 participants 11 lots of cattle Bid on a lot you would like to purchase – 6 highest bids will get cattle

46
Cattle Marketing cont. Market Plan – Incorporate plan and marketing opportunities – Included method of sale Carcass wt Packer Grid Alliance Base Price 82.00 breakeven

47
Cattle Marketing: 1)Angus 2)Angus 3)Herefords 4)Black Baldies 5)Limousin x Angus calfhood implanted 6)Red Angus 7)Red Angus x Continental cross cows 8)Simmental x Red Angus cross cows 9)Charolais x Angus 10)Limousin sired ~ Non-implanted antibiotic free 11)Crossbred 70% colored 30% blacks
Angus 2)Angus 3)Herefords 4)Black Baldies 5)Limousin x Angus calfhood implanted 6)Red Angus 7)Red Angus x Continental cross cows 8)Simmental x Red Angus cross cows 9)Charolais x Angus 10)Limousin sired ~ Non-implanted antibiotic free 11)Crossbred 70% colored 30% blacks")
48
Marketing Methods: Packer Grids (Tyson and Swift) 1)Cutability based grid 2)Quality (CAB type grid) 3)Excel ~ Angus America Black Angus Red Angus 4)Certified Hereford ~ Greater Omaha 5)Laura’s Lean
 1)Cutability based grid 2)Quality (CAB type grid) 3)Excel ~ Angus America Black Angus Red Angus 4)Certified Hereford ~ Greater Omaha 5)Laura’s Lean")
49
Lot 1: Angus Top carcass oriented AI bulls and sired cows History – 85% choice 55% CAB, 10% YG4’s Non implanted Med – Large Frame

50
Lot 2: Angus Angus bulls some carcass EPD’s No History No Implants Med Frame

51
Lot 3: Hereford Hereford x Hereford Carcass oriented bulls for the past 5 years No history Med Frame

52
Lot 4 : Black Baldy Top Hereford bulls x Commercial Angus cows No history Med Frame

53
Lot 5: Blacks Limousin and Angus Bulls X Commercial Angus 65-75 % choice Implanted

54
Lot 6 : Red Angus Top Red Angus Genetics on selected cows History 85 % choice Non Implanted

55
Lot 7: Red Angus sired No history

56
Lot 8: Red Cross Calves Simmental bulls X Red Angus cross cows Excellent growth and production data Little carcass data but positive Implanted

57
Lot 9: Char cross calves Charolais Bulls X Angus and CharxAngus cows Reputable purebred supplier No data Non implanted

58
Lot 10: Limousin Limousin bulls on Limousin x Angus cows No antibiotics or Implants Previously sold to Laura’s Lean

59
Lot 11: 70% colored 30% blacks Charolais bulls on crossbred cows No History Implanted

Similar presentations


 of the meat. Determined by the age and marbling (intramuscular.>")


