Download presentation
Presentation is loading. Please wait.

1
Live Cattle Evaluation

2
What are we trying to determine? u Quality grade u Yield grade u Dressing percentage

3
Quality Grade Factors Maturity Marbling

4
Beef Quality Grading Factors -- Maturity -- u Estimation of physiological age u Classifications: A B C D E (young to old) u determined by degree of bone ossification u most fed cattle = A maturity (< 30 mo of age) u As age , QG
 u determined by degree of bone ossification u most fed cattle = A maturity (< 30 mo of age) u As age , QG ")
5
Bone Maturity Thoracic Cartilagenous Vertebrae Bone Maturity Thoracic Cartilagenous Vertebrae

6
Bone Maturity Thoracic Cartilagenous Vertebrae Bone Maturity Thoracic Cartilagenous Vertebrae

7
Chronological Age of Cattle 30 42 72 96 ABCDE Feedlot Cattle Young Cows Older Cows Heiferettes

8
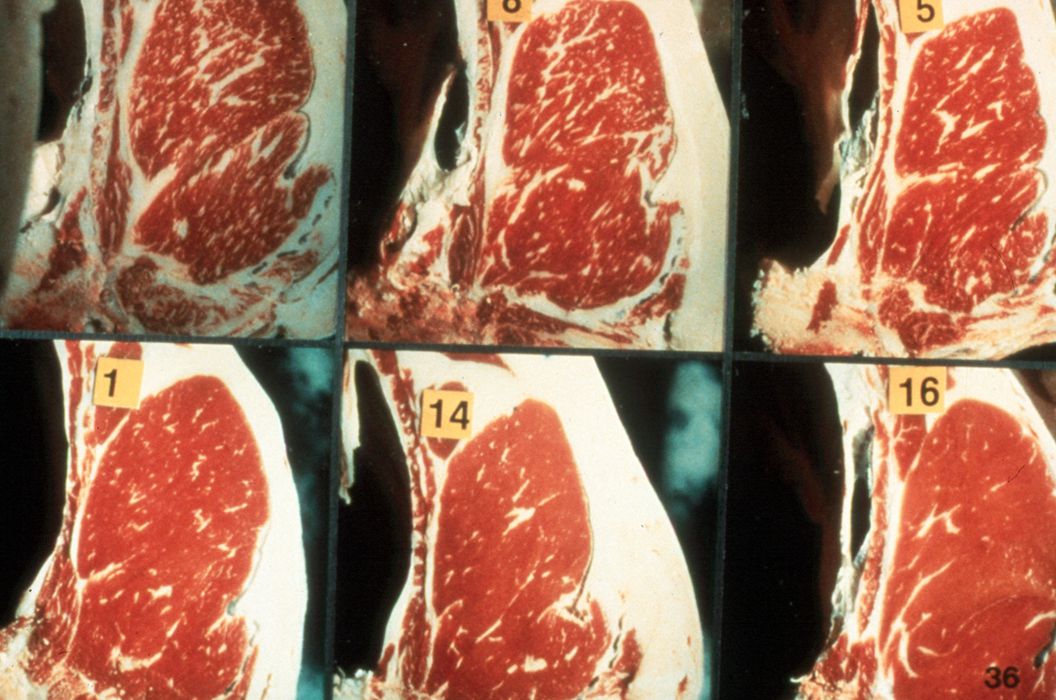
Beef Quality Grading Factors -- Marbling -- u Measure of the intramuscular fat l fat within the muscle l “taste” fat

10
PRIME CHOICE SELECT STANDARD COMMERCIAL UTILITY CUTTER Sl. Abundant Moderate Modest Small Slight Traces Practically Devoid A A B B C C D D E E

11
Beef Yield Grades u Measure of cutability or the percent yield of boneless, closely trimmed retail cuts from the: l chuck l rib l loin l round Wholesale Cuts from the Beef Carcass

12
Interconversion of YG and the % of Boneless, Closely Trimmed Retail Cuts % lean (muscle), % fat % lean (muscle), % fat
, % fat % lean (muscle), % fat")
13
Factors Used to Calculate Beef Yield Grades u Fat over ribeye (in) FOE u % kidney, pelvic, heart fat KPH l of the carcass weight u Ribeye Area (in 2 ) REA u Hot carcass weight HCW As HCW , REA must
 FOE u % kidney, pelvic, heart fat KPH l of the carcass weight u Ribeye Area (in 2 ) REA u Hot carcass weight HCW As HCW , REA must ")
14
Fat thickness 3/4 length of Ribeye Measurement of FOE

15
Measurement of REA

16
Dressing Percentage u Used as a basis for marketing livestock l beef u Usage and importance as the industry moves toward “value-based” marketing. l As fat , dressing percentage l but YG less desirable (poor cutability)
.")
17
Dressing Percentage = hot carcass weight live pay weight 100 Example: If live weight = 1200 lbs HCW = 750 lbs 100 = 62.5% cattle 1200 750

18
Dressing Percentage Example: If live weight = 1200 lbs DP= 65% 1200 X.65 = 780 lb HCW

19
Beef Dressing Percent u Fed Cattle = 63% u Cows = 50% u Factors that affect dressing percentage l “Fill” -- large rumen capacity l fat cover -- fat animals have higher dress l mud on the hide -- add live weight, reduce dress

20
Carcass Evaluation of Beef u Beef quality grading factors (2) l associated quality grades u Beef yield grading factors (4) l associated yield grades u Dressing Percent l factors l importance for valuation of beef Key Points: The Beef Industry
 l associated quality grades u Beef yield grading factors (4) l associated yield grades u Dressing Percent l factors l importance for valuation of beef Key Points: The Beef Industry")
21
How do our customers value our product? High Low

22
How do we value our customers? High Low

Similar presentations