Download presentation
Presentation is loading. Please wait.

1
Data Analysis for Source ID: Examples of Statistical Methods and Results Julie Kinzelman, City of Racine Beach Management Workshop April 14 – 15, 2005, Egg Harbor, WI

2
Association of Bacterial Indicator Levels to Coastal Conditions Can we tell when E. coli will be elevated?

3
Potential Associations Wind Direction Wave Height Estimation Precipitation Surface Water Temperature Presence of Algae

4
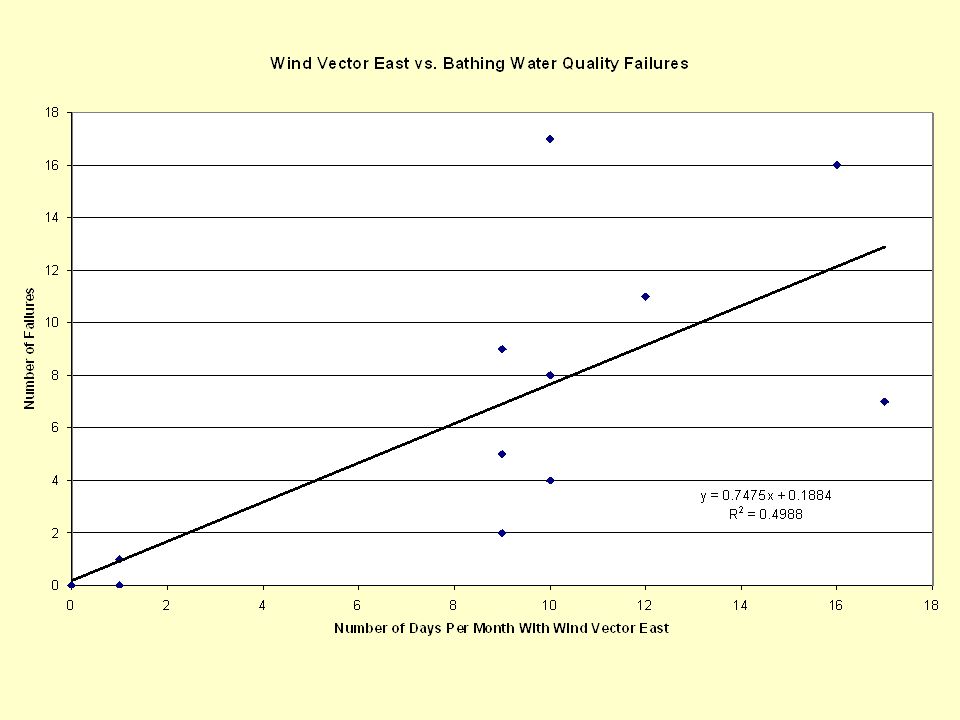
Wind Direction Wind Vector Containing Direction East

5
YEARNUMBER OF DAYS INCLUDING WIND VECTOR EAST (90°) MayJuneJulyAugust 20020*10916 2003 1**91217 2004 1***910 Number of Sampling Events
 MayJuneJulyAugust 20020* ** ***910 Number of Sampling Events")
7
Winds East = High Waves

8
Influence of East Wind In 2 out of the 3 years the increased number of days including wind vector E also reflected an increase in the number of days per month with poor water quality failures This translates to a correlation of ~ 50% Onshore winds frequently increased wave height as noted in field observations

9
Wave Height Estimated Visually (low, medium, or high)
")
10
YEARDAILY FREQUENCY OF WAVE HEIGHT BY MONTH May/JuneJulyAugust/September LowMed.HighLowMed.HighLowMed.High 20026510126941310 20031513061458114 2004146413455169 Frequency of Wave Height

12
The number of days with moderate or high waves increased as the summer progressed. The total number of days designated as having high waves increased in August

13
Local Mathematical Model Best Predictor: E. coli today = 10.801 + 0.248 (yesterday's E. coli count) + 65.859 (wave height) [p = 0.009] Second Best Predictor: Wave Height + Easterly Wind Vector [p = 0.02]
 (wave height) [p = 0.009] Second Best Predictor: Wave Height + Easterly Wind Vector [p = 0.02].")
14
Precipitation Wet Weather Advisories

15
Average Daily Precipitation AVERAGE DAILY PRECIPITATION BY MONTH (CM) YEARMONTH JUNEJULYAUGUST 20020.610.380.48 20030.150.580.18 20040.580.080.33
 YEARMONTH JUNEJULYAUGUST")
16
Monthly Precipitation MONTHLY PRECIPITATION TOTALS (CM) YEARTOTAL MONTHLY PRECIPITATION SEASON TOTAL JUNEJULYAUGUST 2002 12.829.4812.65 34.95 2003 3.6214.084.05 21.75 2004 12.501.788.80 23.08
 YEARTOTAL MONTHLY PRECIPITATION SEASON TOTAL JUNEJULYAUGUST")
19
Although June had high amounts of ppt. it always had the least number of BWQF.

20
2004

21
Rainfall can have an immediate impact on surface water quality

22
Storm Water Discharge to Lake Michigan after Rain Event

23
Rainfall vs. BWQF Rainfall preceded about 50% of all BWQF in Racine in 2004 The impacts of rainfall can be sudden and immediate Pre-emptive advisories may be appropriate Rainfall can impact surface in a variety of ways: –CSO, SSO, Runoff, Storm water discharge

24
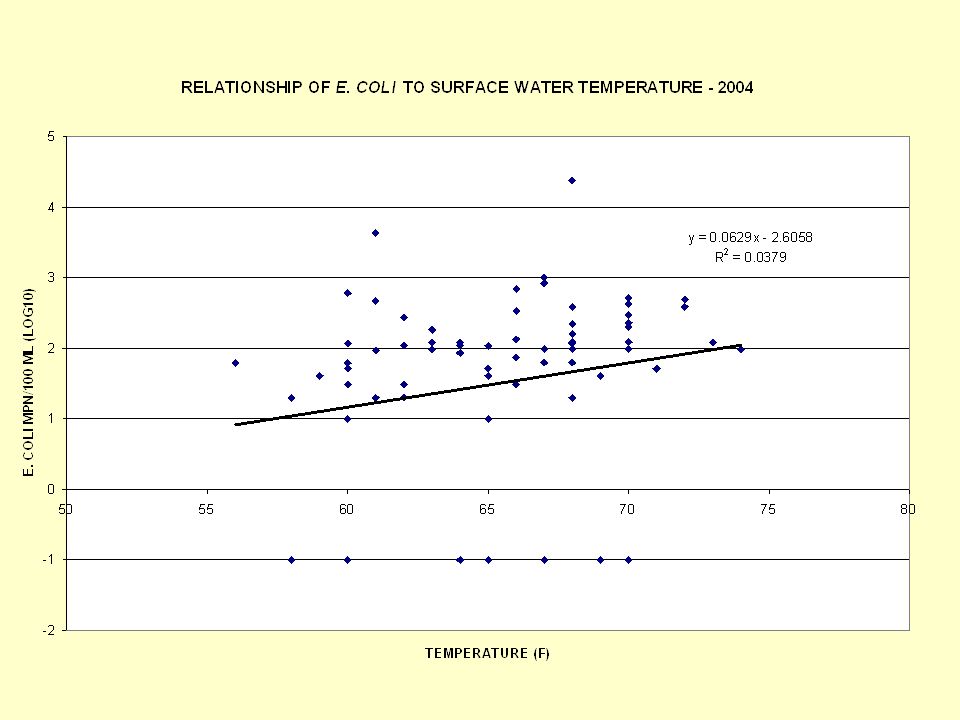
Surface Water Temperature Did Warmer Water = More Bacteria?

25
Upwelling can change surface water temperature

27
Scatter plots of the data demonstrate that a strong correlation did not exist between E. coli and surface water temperature [R2=0.04(2004)]
].")
28
Algae (Cladophora) Was there more E. coli when there was more algae?
 Was there more E. coli when there was more algae")
29
High Amounts of Algae - 2002

30
Low Amounts of Algae - 2004

31
ALGAL PRESENCE VS. E. COLI CONCENTRATION 0 0.5 1 1.5 2 2.5 3 3.5 00.511.522.533.5 ALGAL PRESENCE

32
Association of Algae to BWQF The concentration of E. coli isolated from North Beach did not correlate with the amount of algae noted in the field at the time of collection Neither was there a higher incidence of water quality advisories on days when moderate or high levels of algae were noted

33
Association of Algae to BWQF E. coli concentration, ranked by code relating to Cladophora presence and subjected to ANOVA showed no significant difference (p = 0.64) Limited by the small number of degrees of freedom (n = 27) Correlation may have been noted if the degrees of freedom were higher, i.e. more samples collected
 Limited by the small number of degrees of freedom (n = 27) Correlation may have been noted if the degrees of freedom were higher, i.e. more samples collected.")
34
Best Predictors of Water Quality in Racine, WI Wave Height (> 1.0 ft.) Wind Direction (East)
 Wind Direction (East)")
35
Acknowledgements S. C. Johnson, A Family Company WI DNR Richard Whitman, USGS City of Racine Health Department University of Surrey, RCPEH

36
Too Many Statistics!!!

Similar presentations


 Anomalies utilizing 10 years of MODIS-Aqua data at 4 kilometer resolution James G. Acker NASA GES.>")


 Microwave energy reflects off objects (e.g. hydrometeors) and the return is reflectivity WHAT IS R? Rainfall.>")


