Download presentation
Presentation is loading. Please wait.

1
Storm Damage Assessment Protocol Data Collection and Reporting

2
Overview Data Collection Estimating Engine Report Means Storm Damage Brochure

3
Overview: Pre-storm setup Create random sample Before emergency! Use electronic or manual means Measure tree density and size class Within ROW Also 50’ back from ROW edge Take final steps Pre-Storm report form: useful estimate Storage for future use

4
Overview: Post-storm work Revisit sample segments Debris: choose estimation method Indirect by average crown loss class 0-25%, 26-50%, etc. Loss category images available from FS All trees within 50’ of ROW Direct as CY of debris Only trees within ROW Hazard pruning by size class Hazard removal by size class Enter data, report results

5
Validity from random sampling General discussion earlier Storm type factor Tested for ice storms Low variance 2% sample got within 5% of true value in field test Not tested for wind storms Larger variance May affect required sample size Area of ongoing i-Tree research

6
Data Collection

7
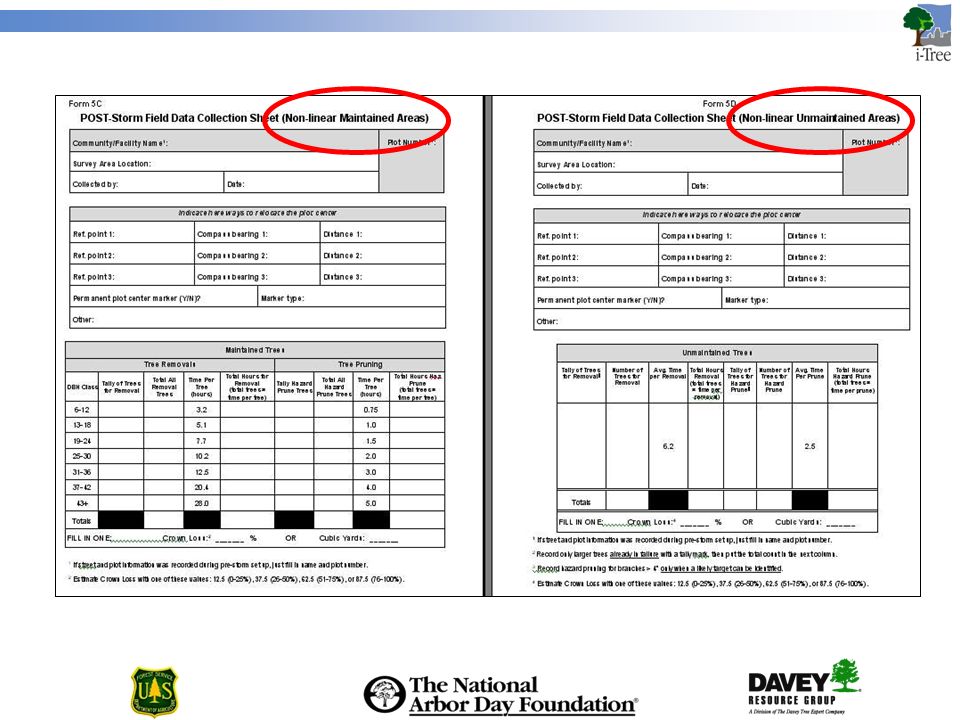
Paper forms In disaster work, good reason to keep paper as option Electricity not a concern Damage possibility minimal Reduces training needed Forms for many different situations In Manual, also can be downloaded from website

10
Manual data entry Easiest to use Excel’s entry form Highlight top row of headers On menu, click Data Form Can also just start typing at cell A1

11
Software: desktop interface Management of data and applications Simple, intuitive Places field data directly into template

12
SDAP Interface

13
Software: PDA application Installed on handheld through Start menu Data uploaded automatically during synchronization

14
Time to Make Believe!

15
Estimating Engine

16
Spreadsheet Estimator built as Excel ® spreadsheet 6 worksheets Home/ReadMe – navigation, help PreStorm Data – setup data PreStorm Analysis – preliminary analysis PostStorm Data – damage data PostStorm Analysis – report form Codes, lookup tables – functional elements Use of Excel ® based on user survey

17
Hyperlinks for easy navigation

18
Report Means

19
Procedure Estimation Starts with field data Uses local costs Scales up with simple formulas Calculation page = report Credibility Ease, speed

20
Validation Sampling indicated on report Means of random sampling Percent of street miles sampled Numbers derived right on sheet Debris Pruning, removal Local costs shown

21
These values can be adjusted by end user

22
Back to SDAP Interface

Similar presentations


 Learning Technologies Division HUMAN CAPITAL DEVELOPMENT.>")


 The content of Excel screen. (2) The Excel ribbon. (3) How to create new workbooks. (4) Excel.>")
 Gao.>")
>")


 Gao.>")

