Download presentation
Presentation is loading. Please wait.

1
SafetyFirst’s Web Site Resources for Reporting A Fast Lane to Insights About Driver Behaviors

2
Fleet Safety Can Reduce Crashes Most crashes are due to driver behavior, choices and attitude. If we spot the behavior before a crash occurs, we can intervene to save a life or spare the injuries

3
Keys to Success Information needs to be timely, credible and consistently investigated with each affected driver Its not about fault finding, its about safety awareness and… The willingness of the driver to accept that change may save their life (whether the issue is wearing protective gear, following safety procedures or driving in a proper manner.)
")
4
Safety IS Our Goal SafetyFirst’s goal is “to reduce commercial vehicle collisions and the costs associated with them” To support this goal we deliver: –observation reports about driver activity and –summary reports to identify trends or patterns in behavior.

5
Safety IS Our Goal Since each fleet client is always pressed for time, we do not ‘flood’ our clients with all the management reports that are “available” However, we have built a report ordering facility on our web site for easy access to a wide variety of custom report options.

6
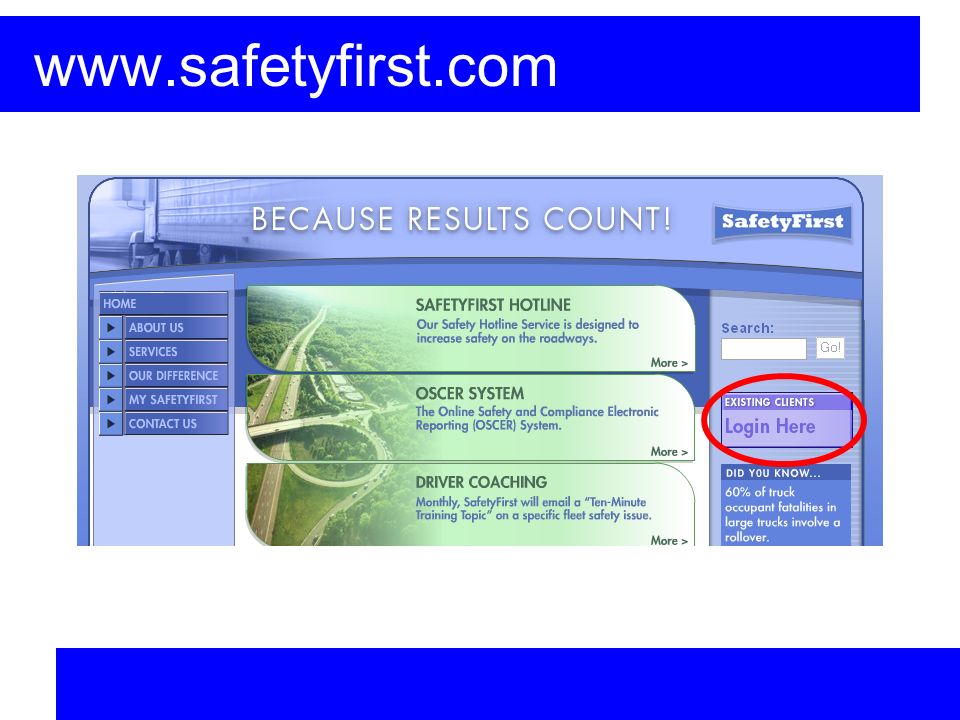
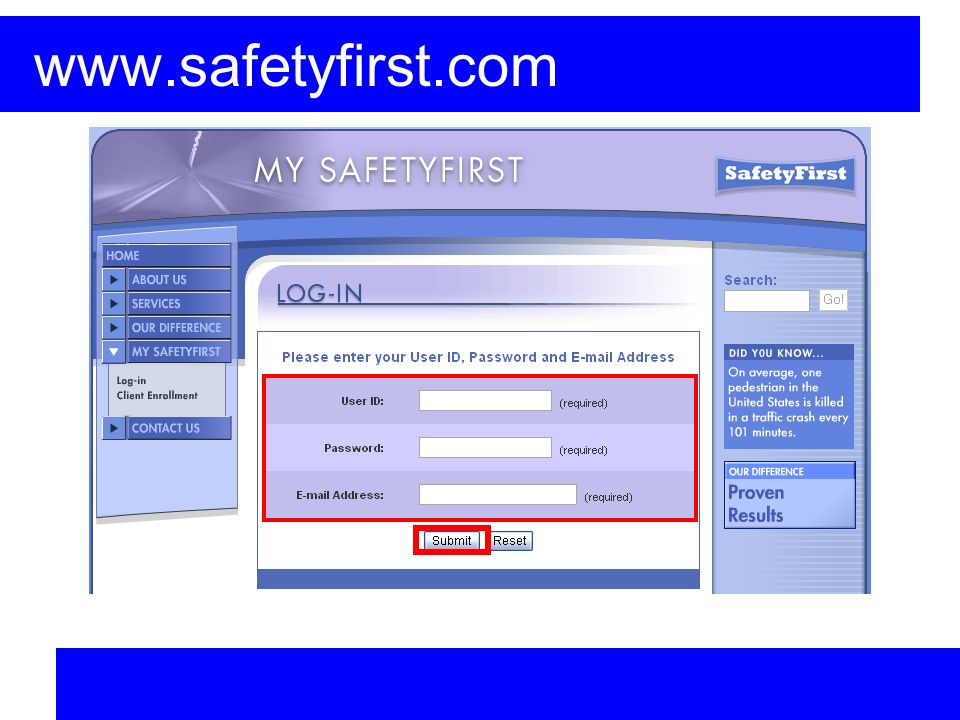
Access to the Resources Each hotline client is provided with a unique ID and password to access our resources, and their company data (derived from our safety hotline process) The log in process is simple, and delivers each client to a menu of choices.
 The log in process is simple, and delivers each client to a menu of choices.")
7
www.safetyfirst.com
9
Customer Options Clicking on the title of each section will take you to a distinct part of our web site

10
Customer Options This presentation will focus on options related to running specialty reports A complete, but separate help guide is available for the “user defined report section”

11
Report / Download Requests The “Report / Download Requests” section provides clients with a range of specialty reports in three formats: –Adobe Acrobat Format (delivered by email as a link or attachment) –On Screen Display –“*.csv” files that can be opened in MS Excel, local database programs or other spread sheet programs
 –On Screen Display – *.csv files that can be opened in MS Excel, local database programs or other spread sheet programs")
12
Report / Download Requests Near the top of the screen, you’ll see your company details: USER234 Someone@Somemail.net XYZ Specialty Corporation Northeast Business Group New Jersey Newark Office If you are a location supervisor, your location should automatically display.

13
Report / Download Requests If your company is divided into multiple locations, regions or divisions, you may have more options to choose from… In this example, your report requests will include all divisions, regions and locations within “Sample Bakery Company 2” (the reports will highlight the relationship of these locations to the data, but it will all be included)
")
14
Report / Download Requests If you wanted to limit the data to a specific Division, Region or Location, you can select them from the drop boxes. In this example, your report requests will include data related to “Location 9” only.

15
Report / Download Requests Clicking on the “Function” drop box will provide several options for onscreen reports USER234 Someone@Somemail.net XYZ Specialty Corporation Northeast Business Group New Jersey Newark Office

16
Report / Download Requests The next few slides will provide additional detail for each of these on screen reports

17
There are three types of reports that we routinely send out – MOR = Motorist Observation Report Daily = Administrative notices Monthly = Summary reports Report / Download Requests Detail = contact information for your location, and a listing of those folks scheduled to receive reports by fax and/or email

18
Report / Download Requests Email / Fax List = A listing of all persons scheduled to receive reports about your drivers. This listing is provided in a different format than the previous “detail” screen: –If you are a corporate manager, you can access all your divisions, regions and locations from one screen –You can immediately save and view as a spread sheet file from this screen.

19
Report / Download Requests Email / Fax List: 1) To change the number of records listed on the screen, pick a new value in the drop box. 2) To include divisions, regions and/or locations that report to your office, click the “Include All Lower Level” checkbox
 To include divisions, regions and/or locations that report to your office, click the Include All Lower Level checkbox.")
20
Report / Download Requests Email / Fax List: 1) To print this screen, just press Ctrl and P keys at the same time, or click on the link provided at the bottom of the page. 2) To save this information as a spread sheet file, click “Save As…”
 To save this information as a spread sheet file, click Save As… .")
21
Report / Download Requests MOR Detail List – A listing of all MORs developed by the program since the initial decal shipment date.

22
Report / Download Requests MOR Detail List – Each column can be sorted, onscreen, like a spread sheet. Click on a column header to resort the list (ascending sort by that column). The little ‘up arrow’ in each column enables a descending sort of the table by that column.
. The little ‘up arrow’ in each column enables a descending sort of the table by that column..")
23
Report / Download Requests MOR Detail List – This report provides a quick reference to all activity, and by sorting the table by report type, you can quickly identify compliment calls!

24
Report / Download Requests MOR Detail List – You can click on the report number to call up the specific details of each MOR.

25
Report / Download Requests MOR Detail List – You can click on the “Edit” link to call up the specific details of each MOR in a format where you can submit updates.

26
Report / Download Requests MOR List – A different format to display MORs that have been recorded.

27
Report / Download Requests MOR List – This format provides some flexibility in what data is presented – –You can include multiple locations or limit to a single location –You can include only returned or Non-returned reports –you can include all MORs, or just those within a date range.

28
Report / Download Requests MOR List features: –Can print or save details as a spread sheet –Can sort details on screen –Provides more data items than other on screen MOR reports –Will show detail of locations for multiple location clients

29
Report / Download Requests MOR Repeat – Shows each driver with repeat complaints and enables you to save into a spread sheet file.

30
Report / Download Requests MOR Response Time – Shows the turnaround time of each returned MOR and the average return time (in days) for each location, and the company in aggregate.
 for each location, and the company in aggregate.")
31
Report / Download Requests Vehicle List – Shows all enrolled vehicles, their details and assigned location.

32
Report / Download Requests Rank and Rate – Shows a summary of activity for any valid date range. Enables multi-location clients to directly compare one location (or region/division) against any other.
 against any other..")
33
Report / Download Requests Rank and Rate features: –Can be sorted on screen like a spread sheet –Can be saved as a spread sheet file –Highlights potential trouble areas in red –Client can change date range and refresh report

34
Report / Download Requests Monthly Recap - provides an update of activity on a month by month basis. This report is automatically sent by email to our clients, but may also be accessed thru our web site.

35
Report / Download Requests Monthly Recap - provides an update of activity on a month by month basis. A full help guide for this report is available.

36
Report / Download Requests Other reports are available that are sent as an emailed link or attachment: –Monthly Policyholder Report (same report that is automatically emailed each month) –Policyholder Overview Report –Vehicle Count By Type –Vehicle List –Download – Driver Incident Data –Monthly Summary Report (*.csv format) –MOR Summary of Behavior Types
 –Policyholder Overview Report –Vehicle Count By Type –Vehicle List –Download – Driver Incident Data –Monthly Summary Report (*.csv format) –MOR Summary of Behavior Types")
37
Report / Download Requests Policyholder Overview Report: –A series of four attachments Summary chart of activity including top five behavior categories reported on MORs during the specified date range List of MORs developed during the date range Detail of the MORs developed during the date range Listing of Drivers with Repeat Complaints (if any) –If there were no drivers with repeat complaints, that section of the report will not appear.
 –If there were no drivers with repeat complaints, that section of the report will not appear.")
38
Report / Download Requests Vehicle Count By Type: –Provides a listing of vehicles sorted by descriptions (i.e. 25 vans, 10 pick ups, etc.) –Displays a pie chart and provides a spread sheet file
 –Displays a pie chart and provides a spread sheet file.")
39
Report / Download Requests Vehicle List: –Similar to on screen report, it is provided as a spread sheet file Download – Driver Incident Data: –Provides a spread sheet of each data element contained on the MOR form –Enables detailed searches of MOR data for trends or patterns such as day of week or time of day, etc.

40
Report / Download Requests Monthly Summary Report (*.csv format) –The same data that is provided on the monthly report, but in spread sheet format MOR Summary of Behavior Types –A pie chart and supporting spread sheet showing a tally of reported behaviors during a specified date range.
 –The same data that is provided on the monthly report, but in spread sheet format MOR Summary of Behavior Types –A pie chart and supporting spread sheet showing a tally of reported behaviors during a specified date range.")
41
Report / Download Requests Other functions within this section include the ability to call up a vehicle list that can be modified, updated or edited. Large number of vehicle updates can be processed by phone, fax, email or through computer data file transfer; however, some clients like to make updates through our web site – especially if it involves only one or two vehicles at a time.

42
Summary We’d like to hear from you about: –additional reports you’d like to see, or –ways to present information in easy-to-use formats. Our best reports came from client suggestions – let us hear your best ideas!

43
THANK YOU Thank you for your commitment to reducing crashes and the costs associated with them. Together, we can save lives

Similar presentations


>")


