Download presentation
Presentation is loading. Please wait.

1
Electricity Technology in a Carbon-Constrained Future NARUC 2007 Summer Committee Meetings New York City, New York July 16, 2007 Steven Specker President and CEO

2
2 © 2007 Electric Power Research Institute, Inc. All rights reserved. Presentation Objective Answer the following two questions: What is the technical feasibility of slowing, stopping, and reversing the increase of CO 2 emissions from the U.S. electric sector? What is the potential impact of the availability of advanced electricity technologies on the cost of electricity in a carbon-constrained future?

3
3 © 2007 Electric Power Research Institute, Inc. All rights reserved. U.S. Electricity Generation Forecast* 3826 TWh 5406 TWh 2005 2030 * Base case from EIA “Annual Energy Outlook 2007” ~40% Growth

4
4 © 2007 Electric Power Research Institute, Inc. All rights reserved. Base case from EIA “Annual Energy Outlook 2007” –includes some efficiency, new renewables, new nuclear –assumes no CO 2 capture or storage due to high costs Forecasted U.S. Electricity Sector CO 2 Emissions

5
5 © 2007 Electric Power Research Institute, Inc. All rights reserved. EIA Base Case 2007 EPRI CO 2 “Prism” TechnologyEIA 2007 ReferenceTarget EfficiencyLoad Growth ~ +1.5%/yrLoad Growth ~ +1.1%/yr Renewables30 GWe by 203070 GWe by 2030 Nuclear Generation12.5 GWe by 203064 GWe by 2030 Advanced Coal Generation No Existing Plant Upgrades 40% New Plant Efficiency by 2020–2030 150 GWe Plant Upgrades 46% New Plant Efficiency by 2020; 49% in 2030 CCSNoneWidely Deployed After 2020 PHEVNone 10% of New Vehicle Sales by 2017; +2%/yr Thereafter DER< 0.1% of Base Load in 20305% of Base Load in 2030 Achieving all targets is very aggressive, but potentially feasible

6
6 © 2007 Electric Power Research Institute, Inc. All rights reserved. Presentation Objective Answer the following two questions: What is the technical feasibility of slowing, stopping, and reversing the increase of CO 2 emissions from the U.S. electric sector? What is the potential impact of the availability of advanced electricity technologies on the cost of electricity in a carbon-constrained future?

7
7 © 2007 Electric Power Research Institute, Inc. All rights reserved. Economic Model EPRI Economic Analysis Model (MERGE) Designed to examine economy-wide impacts of climate policy Each country or group of countries maximizes its own welfare Prices of each GHG determined internally within model Top down model of economic growth Technological detail in energy sector One of three models used by U.S. Climate Change Science Program and in many other international and domestic studies.
 Designed to examine economy-wide impacts of climate policy Each country or group of countries maximizes its own welfare Prices of each GHG determined internally within model Top down model of economic growth Technological detail in energy sector One of three models used by U.S. Climate Change Science Program and in many other international and domestic studies..")
8
8 © 2007 Electric Power Research Institute, Inc. All rights reserved. Prism electric sector CO 2 emission profile Assumed Economy-wide CO 2 Constraint Prism profile closely approximated by an economy-wide CO 2 emission constraint which is flat from 2010 to 2020 followed by a reduction of 3%/year

9
9 © 2007 Electric Power Research Institute, Inc. All rights reserved. Technology Cases Full Portfolio Case Assumes all technologies from the Prism technology feasibility analysis are available to be deployed by the target dates Limited Portfolio Case Assumes that Coal w/CCS and Nuclear ALWRs are not available for deployment Modeled Two Technology Cases Using Economy- wide CO 2 Constraint which results in the Prism profile for the electric sector

10
10 © 2007 Electric Power Research Institute, Inc. All rights reserved. Economic Modeling Results (Prism CO 2 Profile) 200020102020203020402050 Trillion kWh per year 0 1 2 3 4 5 6 7 Solar Wind Hydro Nuclear Gas w/CCS Gas Oil Coal w/CCS Coal Demand Reduction (price-induced) 0 1 2 3 4 5 6 7 200020102020203020402050 Trillion kWh per year Full Portfolio (with CCS and ALWR’s) Limited Portfolio (no CCS or ALWR’s)
 Trillion kWh per year Solar Wind Hydro Nuclear Gas w/CCS Gas Oil Coal w/CCS Coal Demand Reduction (price-induced) Trillion kWh per year Full Portfolio (with CCS and ALWR’s) Limited Portfolio (no CCS or ALWR’s).")
11
11 © 2007 Electric Power Research Institute, Inc. All rights reserved. Economic Modeling Results 200020102020203020402050 Trillion kWh per year 0 1 2 3 4 5 6 7 Solar Wind Hydro Nuclear Gas w/CCS Gas Oil Coal w/CCS Coal Demand Reduction (price-induced) 0 1 2 3 4 5 6 7 200020102020203020402050 Trillion kWh per year Full Portfolio (with CCS and ALWR’s) Limited Portfolio (no CCS or ALWR’s) $65 to $100/MWh* *2050 wholesale generation cost 2007 $ $160 to $250/MWh* (Prism CO 2 Profile)
 Trillion kWh per year Full Portfolio (with CCS and ALWR’s) Limited Portfolio (no CCS or ALWR’s) $65 to $100/MWh* *2050 wholesale generation cost 2007 $ $160 to $250/MWh* (Prism CO 2 Profile).")
12
12 © 2007 Electric Power Research Institute, Inc. All rights reserved. Conclusions It is technically feasible to slow, stop, and eventually reduce the increase of CO 2 emissions from the U.S. electric sector. But it requires: –Commitment to aggressive public and private sector RD&D. –Accelerated commercial deployment of advanced technologies. Meeting future CO 2 constraints will increase the cost of electricity. The magnitude of the increase depends on: –CO 2 policy and it’s timing. –The availability of advanced electricity technologies and the timing of their commercial deployment. Technology is critical to managing the cost of CO 2 policy

13
13 Global cost curve of GHG abatement opportunities beyond business as usual 2030 0124252273456789 0 10 20 30 40 -10 -100 -110 -120 -130 -140 -150 -160 26 -30 -40 -50 -60 -70 -80 -90 1918171615141312111020212223 -20 Cost of abatement EUR/tCO 2 e Insulation improvements Fuel efficient commercial vehicles Lighting systems Air Conditioning Water heating Fuel efficient vehicles Sugarcane biofuel Nuclear Livestock/ soils Forestation Industrial non-CO 2 CCS EOR; New coal Industrial feedstock substitution Wind; low pen. Forestation Cellulose ethanol CCS; new coal Soil Avoided deforestation America Industrial motor systems Coal-to- gas shift CCS; coal retrofit Waste Industrial CCS Abatement GtCO 2 e/year Avoid deforestation Asia Stand-by losses Co-firing biomass Smart transit Small hydro Industrial non-CO 2 Airplane efficiency Solar ~27 Gton of abatement below 40 EUR/ton (relative to 58 Gton under BAU) ~7 Gton of negative and zero cost opportunities Fragmentation of opportunities across sectors and geographies CCS; early retirement
 ~7 Gton of negative and zero cost opportunities Fragmentation of opportunities across sectors and geographies CCS; early retirement.")
14
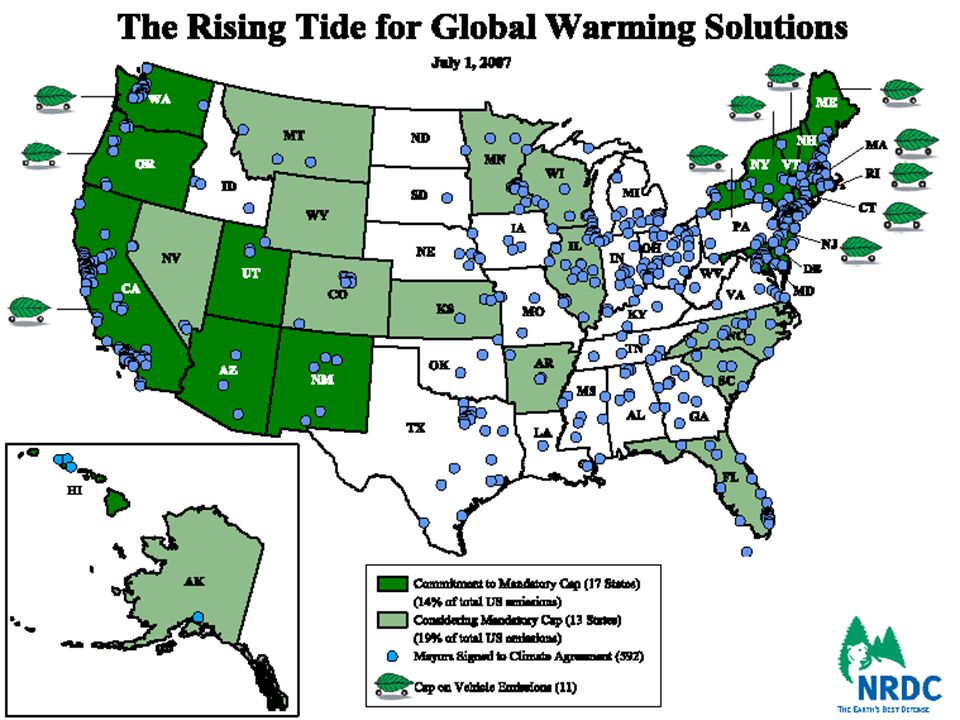
Minimizing Costs for Consumers Under a Global Warming Pollution Cap Dale S. Bryk Natural Resources Defense Council NARUC Summer Conference July 16, 2007

16
Driving Investment in Least Cost Solutions Price signal of cap or tax (does not overcome market barriers) Allowance revenue Essential complementary policies – Energy efficiency procurement standards – Remove utility disincentives (revenue decoupling) – System benefit charge programs – Codes and standards
 Allowance revenue Essential complementary policies – Energy efficiency procurement standards – Remove utility disincentives (revenue decoupling) – System benefit charge programs – Codes and standards")
17
Allowance Distribution Objectives Protect consumers Reduce overall program costs Advance program goals/ promote clean energy Avoid windfall profits Avoid perverse incentives Transition assistance for workers

18
ElizabethA. Moler, Executive V.P. Exelon, Corp.

Similar presentations


: Diversifying the U.S. Electricity Portfolio Marc Santos 2008 ASME WISE Intern University of Massachusetts.>")

 April 2009 1.>")


