Download presentation
Presentation is loading. Please wait.

1
Freight Analysis Framework version 3 (FAF3) __________ Talking Freight Webinar October 2010
 __________ Talking Freight Webinar October 2010")
2
How does freight movement affect congestion, infrastructure, safety, and the environment? How does congestion, delay, and cost affect freight movement? How do shifts in the economy, activity among regions, and global trade affect freight movement? How will policies affect freight movement and what are the consequences? Where can investments be made to improve operations or increase capacity? Understanding Freight Transportation

3
To Understand We Need to Know How much & what freight moves from place to place? Weight Value Commodity Where & how is freight moving? Origin & destination Route used Mode of transportation When is freight being carried? Season Time of day

4
The Big Picture FAF3 integrates data from a number of sources to provide: A data matrix with tonnage and value of regional freight flows by commodity and mode for 2007, with forecasts to 2040, and annual provisional updates An assignment of tons to freight-hauling trucks on individual highway segments

5
FAF3 Details Value and weight for all domestic shipments, exports, and imports 8 Domestic modes (truck, rail, water, air, multiple modes and mail, pipeline, other & unknown, and no domestic mode) 7 Foreign modes 123 Domestic regions 8 International regions (Canada, Mexico, & 6 groupings of countries based on UN definitions) 43 Commodity classes (2-digit SCTG codes)
 7 Foreign modes 123 Domestic regions 8 International regions (Canada, Mexico, & 6 groupings of countries based on UN definitions) 43 Commodity classes (2-digit SCTG codes)")
6
FAF3 Regions South, Central & Western Asia Eastern Asia Canada Mexico Rest of Americas Europe South-Eastern Asia And Oceana Africa

7
The Bottom Line FAF provides a comprehensive national picture of freight flows and baseline forecasts to support policy studies FAF shows states and regions their major trading partners with the volumes and sources of through traffic at a corridor level Local specific planning and project analysis usually requires supplemental data collection to provide local detail

8
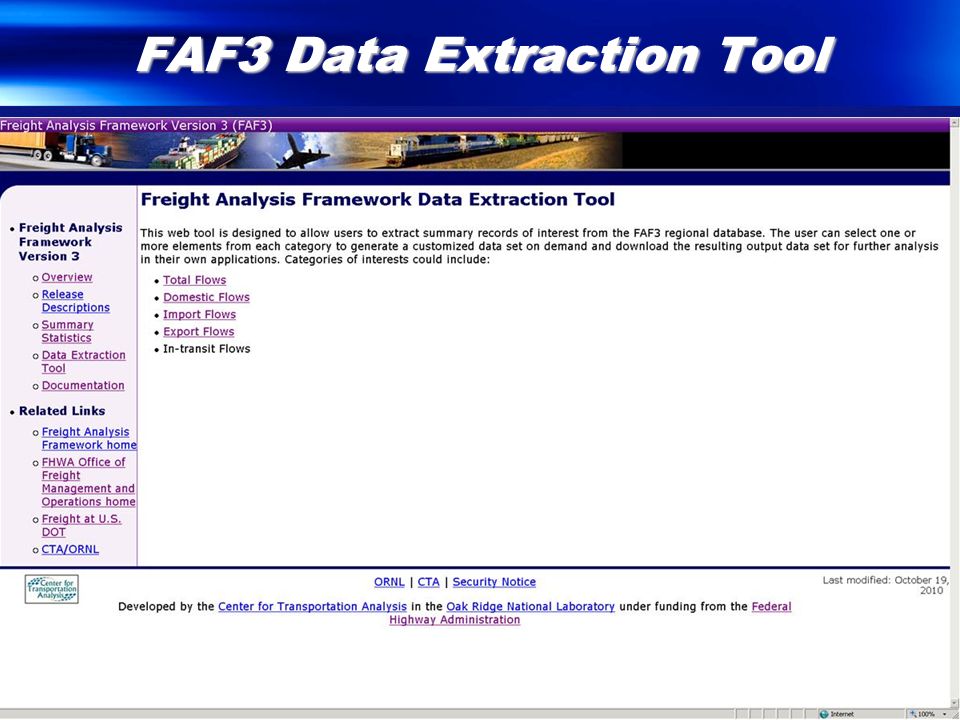
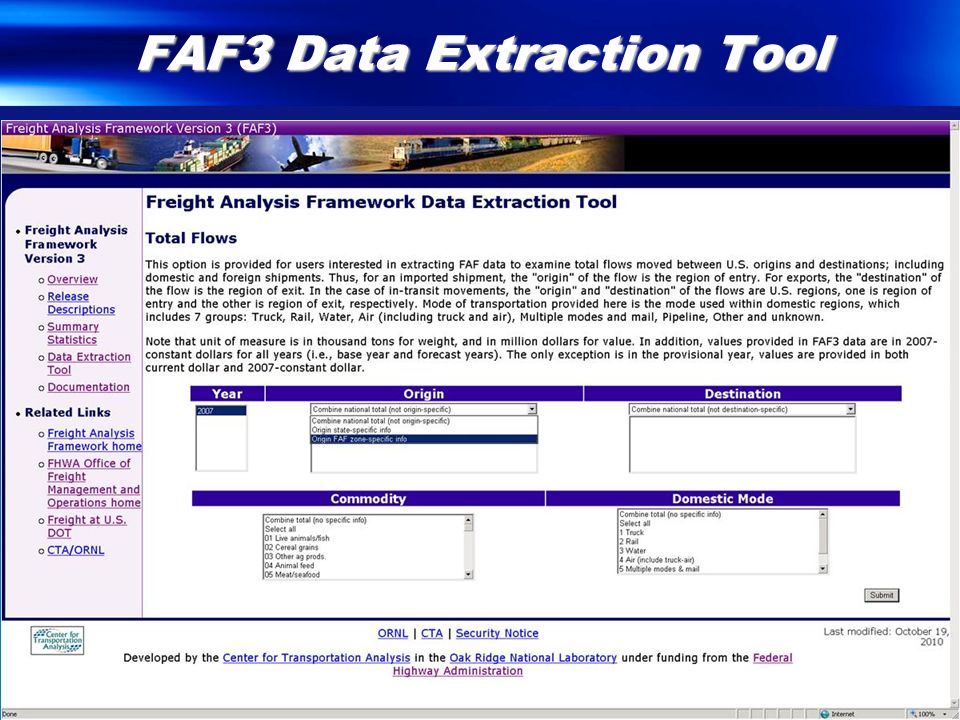
FAF3 Data Extraction Tool A web based data summary tool that enables FAF3 users to easily extract the specific data elements they require from the regional database Features: all levels of detail tabular output and sorting capability download results in.csv format

9
FAF3 Data Extraction Tool

12
Download the table View and sort on- screen Or

13
FAF3.0 - July 2010 Regional freight flow data 2007 Data summary and extraction tool FAF3.1 - October 2010 Revisions to FAF3.0 2007 data Forecasts from 2015 to 2040 Network assignment (maps) Annual provisional update for 2009 FAF3.2 - 2011 Reprocess 2002 & 1997 estimates Online mapping capability FAF3 Timeline
 Annual provisional update for 2009 FAF Reprocess 2002 & 1997 estimates Online mapping capability FAF3 Timeline")
14
We Rely on Customer Feedback Do the estimates we publish align with local observations? What would make existing freight data resources more usable? What are the major freight issues you and your partners are trying to address?

15
Accessing FAF3 Data FHWA Website: http://ops.fhwa.dot.gov/freight/freight_analysis/faf/index.htm DOT Freight Website: http://www.freight.dot.gov/ Oak Ridge National Lab Website: http://cta-gis.ornl.gov/faf/

16
Thank You! Without Data It’s Just An Opinion. Please send questions to: faf@dot.gov

Similar presentations

 A Multimodal Freight Routing Model Frank Southworth Oak Ridge National Laboratory Oak Ridge, TN 37831 NETS Program Review.>")
 Data Fusion Efforts and Issues Frank Southworth Oak Ridge National Laboratory Oak Ridge, TN 37831 NETS Program Review.>")


 P ILOT P ROJECT Paul A. Belella Parsons Corporation Annual Meeting March 23, 2015.>")
