Download presentation
Presentation is loading. Please wait.

1
www.thebeatnews.org Jane Winn jane@thebeatnews.org 413-230-7321jane@thebeatnews.org

2
Projectin service Nov. of: Amount in bcf/d locationDocket # Connecticut Expansion 20160.073 loops: NY, MA, CTCP14-529 TGP Algonquin Incremental Market (AIM) 20160.34NY, across CT, touches RI, to Boston CP14-96 Spectra (DEIS) Atlantic Bridge2017 or later0.1 to 0.6NY, across CT, touches RI, to Boston Spectra Access Northeast 2018“”existing footprint – very sketchy – how much is really AIM and AB? Spectra w/ NoEastUt Northeast Energy Direct (NED) Nov 20182.2NY, across Mass to Dracut, with loops & laterals in CT, RI, NH PF14-22 Kinder Morgan/TGP Proposed Pipelines
 NY, across CT, touches RI, to Boston CP14-96 Spectra (DEIS) Atlantic Bridge2017 or later0.1 to 0.6NY, across CT, touches RI, to Boston Spectra Access Northeast 2018 existing footprint – very sketchy – how much is really AIM and AB. Spectra w/ NoEastUt Northeast Energy Direct (NED) Nov NY, across Mass to Dracut, with loops & laterals in CT, RI, NH PF14-22 Kinder Morgan/TGP Proposed Pipelines.")
3
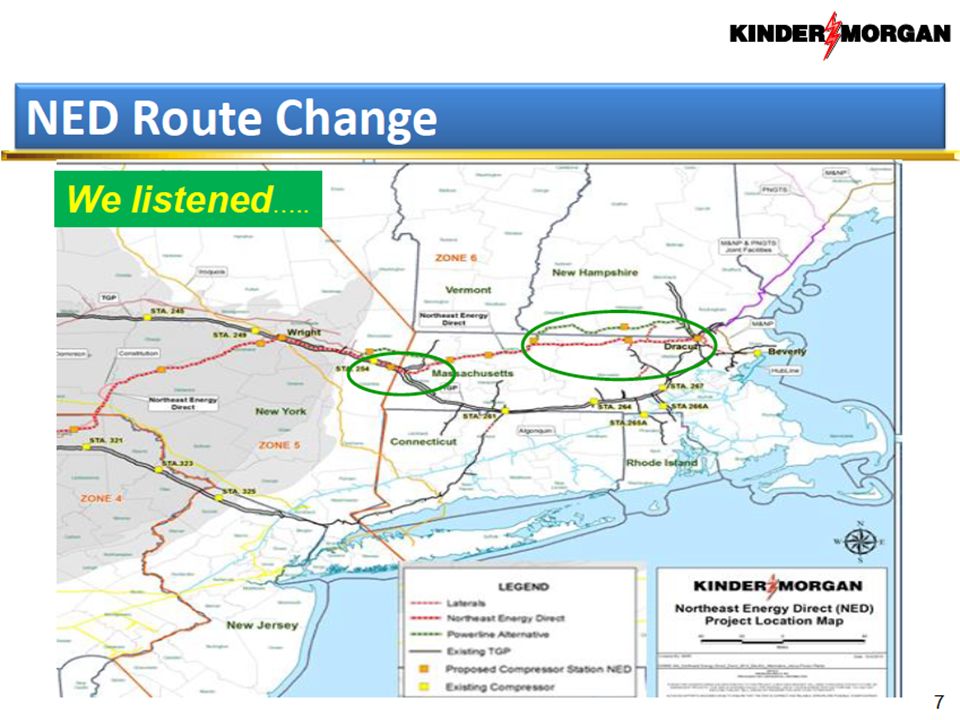
Northeast Energy Direct (NED) Kinder Morgan / Tennessee Gas Pipeline Nov 2018, 2.2 billion cubic feet per day
 Kinder Morgan / Tennessee Gas Pipeline Nov 2018, 2.2 billion cubic feet per day")
5
Wildlife habitat fragmentation, spread invasive species, cut down forests, devastate wetlands, take premanently protected land in violation of state constitution Composite map assembled by No Fracked Gas in Mass Northeast Energy Direct (NED) earliest November 2018, 2.2 bcfd
 earliest November 2018, 2.2 bcfd")
6
But… Natural Gas Is: NOT Clean Won’t be Cheap Won’t be Reliable We Don’t need it

7
Propublica image: https://www.propublica.org/special/hydraulic-fracturing-national

8
Image: Union of Concerned Scientists

9
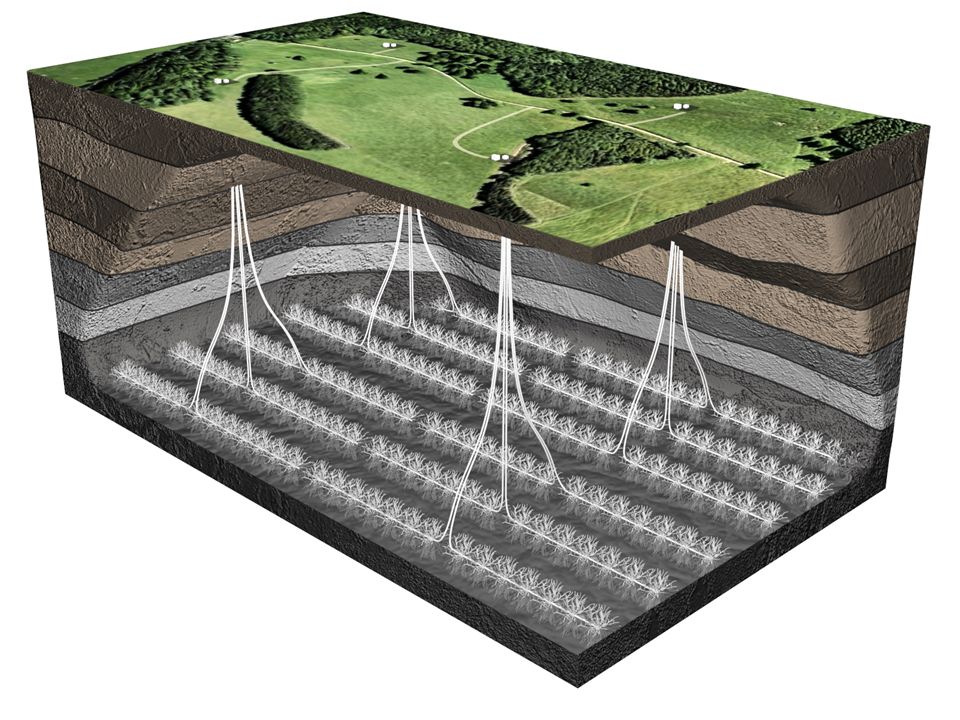
2-10 million gallons of water per well, 4 million pounds of proppant per well, 40 to hundreds of tons of Toxic chemicals per well. From well documented article Earthworks Action: hydraulic fracturing 101: http://www.earthworksaction.org/issues/detail/hydraulic_fracturing_101

11
Clean? Gas Leaks: Boston Methane 34 times as powerful as CO 2 over 100 yrs 86 times over 20 yrs According to the IPCC 2013 report 2.7% of NG coming into Boston is leaking out polluting our atmosphere Harvard study Released 1/23/15

12
Shale gas and tight-sands unconventional natural gas, upstream and midstream emissions (Howarth et al. 2012, background paper, National Climate Assessment) Direct, landscape scale measurements!!
 Direct, landscape scale measurements!!.")
13
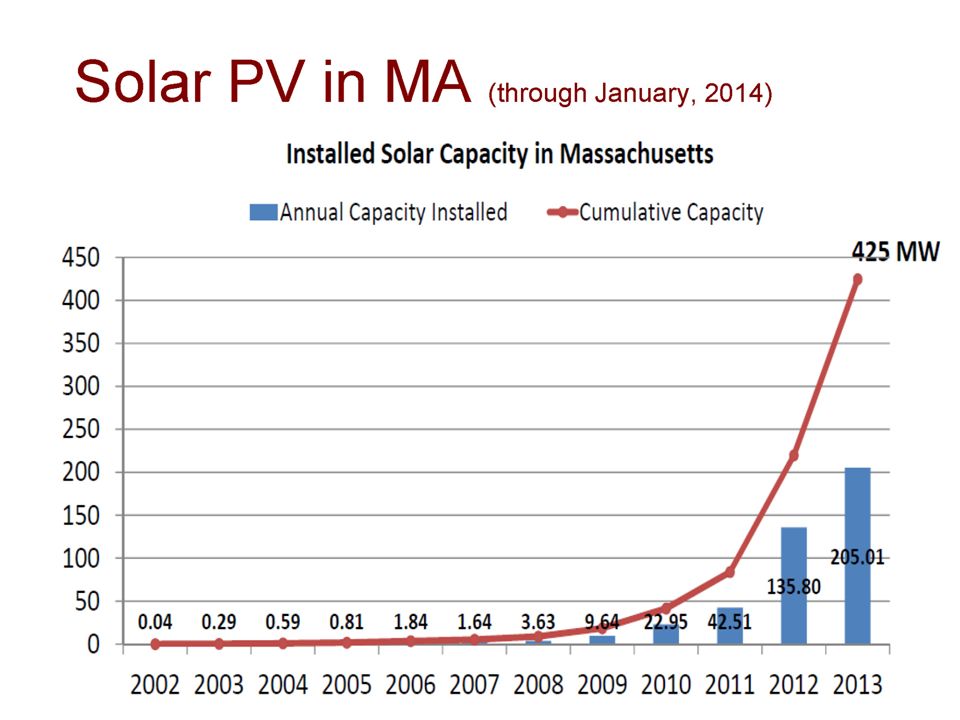
Cheap? Compared To What? Right now NG prices are very low in the US What is the current fuel cost of: Solar? Wind? Hydro? 2013, 50% of the MA's new electric generation was either solar or wind. 2014 more than 50% of Denmark’s electricity was from renewables. (Just to be clear, we advocate distributed, individual and community scale renewables)
.")
14
Early Kinder Morgan/Tennessee Gas Pipeline slide

16
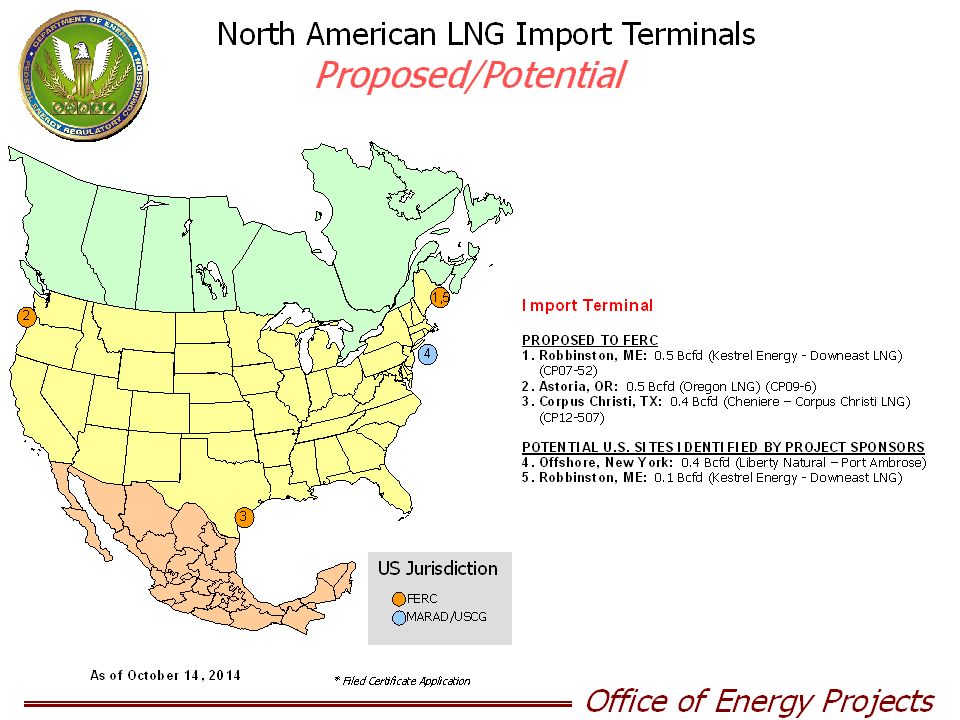
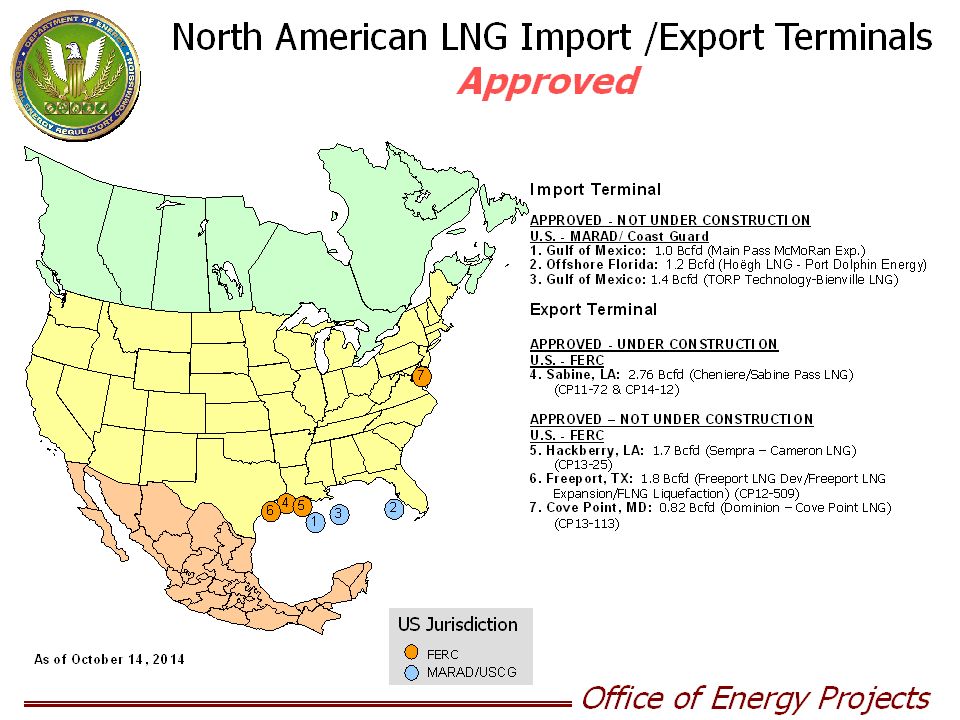
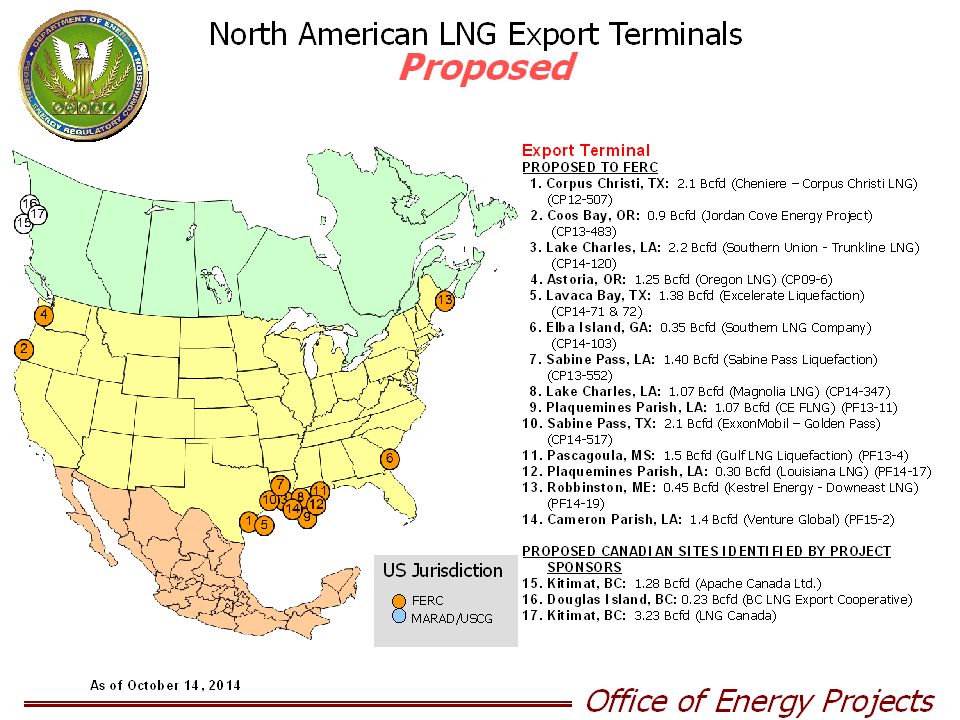
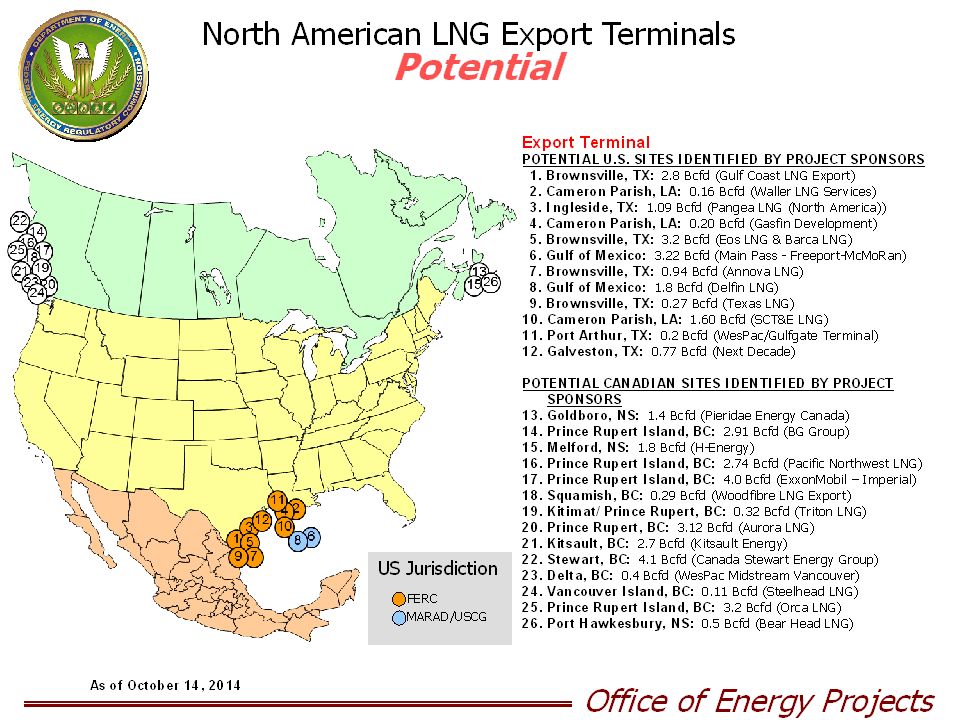
FERC Site: Proposed Export Terminals

19
St Johns, New Brunswick - 1.2 bcf/d capacity (55% of NED annual capacity)
")
20
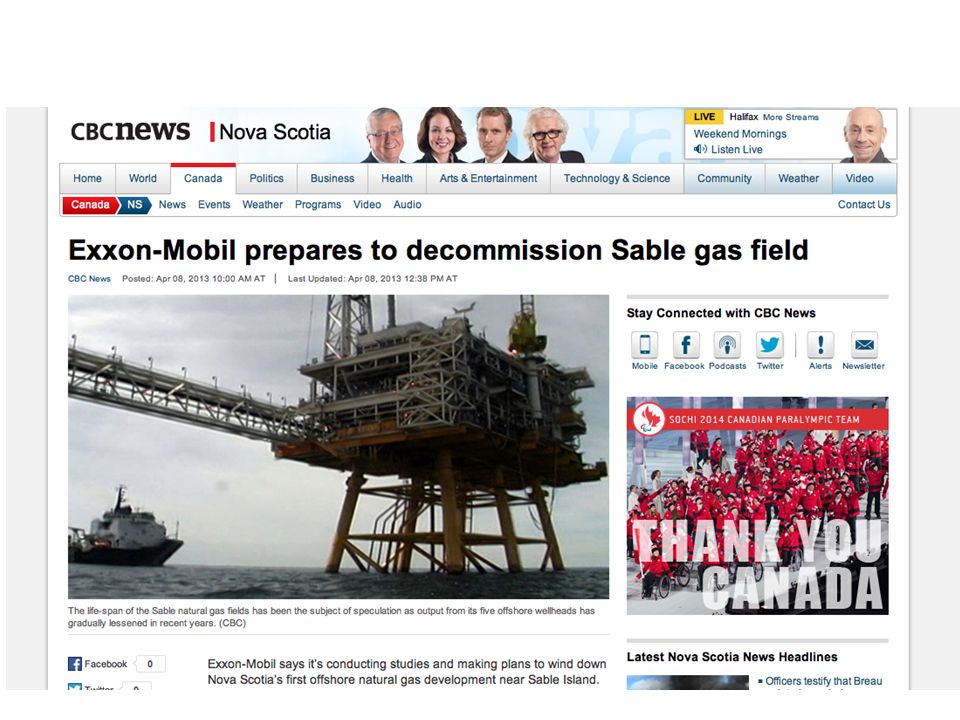
Goldboro, Nova Scotia Signed 20 yr agreement, starting in 2020, for delivery of natural gas to western Europe 5 million metric tons = 30% of NED annual capacity 10 million metric tons capacity

21
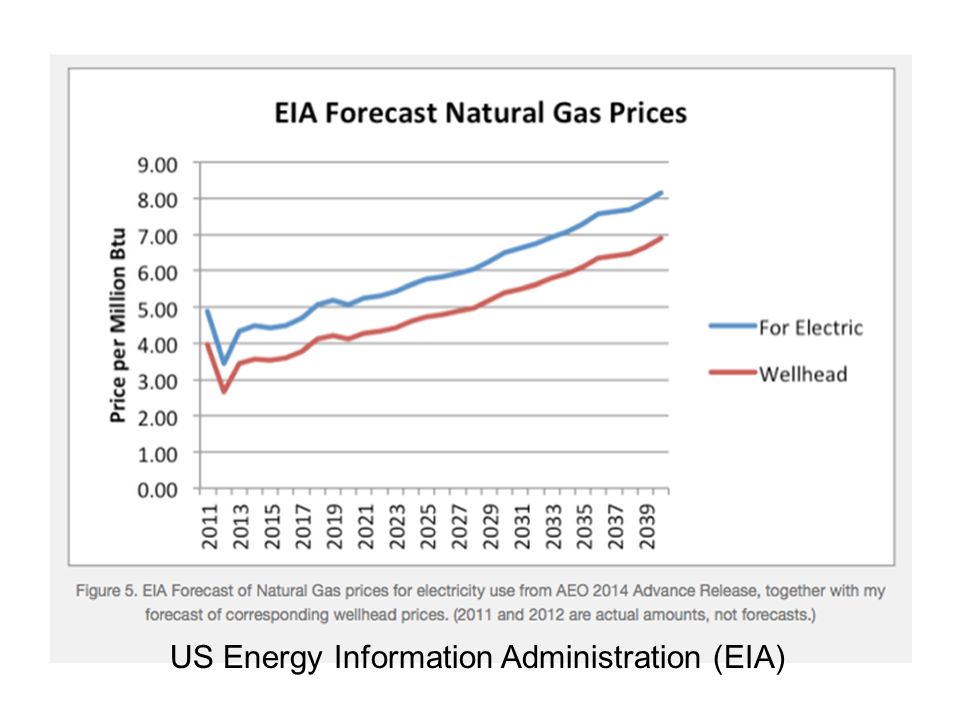
US Energy Information Administration (EIA)
")
23
What Will The Price Be In The Future? We are overdependent on natural gas Overseas prices are much higher than ours What happens when we further increase our dependence on natural gas? Supplies may dry up

24
Reliable? Compared To What? (million cubic feet)
")
26
Reliable? Only about 2% of Pennsylvania has been drilled – but they started with the sweet spots.

27
Put Hughes p 300 peak gas figure here

28
Marcellus shale dry-gas production rates and well number evolution are analyzed to understand overall productivity. A precise linear dependence between production rate and well numbers is demonstrated. Marcellus proved reserves, along with production rate, allow projection of life span, which is shown far less than the 100 years, closer to 10 years. The closeness to complete depletion of any domestic reservoir should lead to pricing escalation. An enhanced Hotelling model is derived, based on the entire US NG reserves, demand, and GDP. With EIA (2013) Proved Reserves of Marcellus NG, with the escalated price model above, profitability should be impressive, but drop to zero by 2019 -- per our pro forma. http://seekingalpha.com/article/2118153-marcellus-shale-through- a-glass-darkly Market Analysis
 Proved Reserves of Marcellus NG, with the escalated price model above, profitability should be impressive, but drop to zero by per our pro forma. a-glass-darkly Market Analysis.")
29
Who Is This Pipelines For? Electric power generation Residential and business Natural Gas (NG) customers have firm contracts. (this is not propane, that’s different) Power industry buys NG on the spot market – peak winter day price spikes The idea is to gamble that a pipeline would bring electric prices down… but the idea is also to have electric rate payers pay to ensure the pipelines were built.
 customers have firm contracts. (this is not propane, that’s different) Power industry buys NG on the spot market – peak winter day price spikes The idea is to gamble that a pipeline would bring electric prices down… but the idea is also to have electric rate payers pay to ensure the pipelines were built..")
30
ISO-New England (Independent System Operator) The air traffic controller of our electric grid NUMBER ONE concern for last couple of years running is our dependence on natural gas Right now more than 50% of electric generation is from natural gas Their solution? More natural gas?

31
ISO-New England (the air traffic controllers of the electric grid) - against any ISO solution that "reduced the opportunity costs priced into the gas market during a time of high gas demand,... would lower gas prices and send the wrong signal about the relative scarcity of natural gas. These lower prices would also be reflected in the electricity market." From the FERC docket ER13-1851, Motion to Intervene and Comments of Algonquin Gas Transmission, LLC and Maritimes and Northeast Pipeline, L.L.C., 3 (quoting ISO-NE filing at 7) (July 19, 2013). Emphasis added
 (July 19, 2013). Emphasis added.")
32
This winter ISO-New England is treating natural gas the same way it treats oil Changes at ISO-New England Thanks to the hard work at Conservation Law Foundation, Acadia Center, and other great organizations – and the anti-pipeline grassroots uprising!

33
January 21, 2015 - ISO is going to (starting in 2019) count renewable energy Distributed Generation (DG) in calculating how much electricity capacity it buys. For every 100 MW over, ratepayer overpay $200 million CLF - http://www.clf.org/blog/clean-energy-climate-change/iso-corrects-big-mistake-http://www.clf.org/blog/clean-energy-climate-change/iso-corrects-big-mistake- will-count-renewable-energy/ Changes at ISO-New England Thanks to the hard work at Conservation Law Foundation, Acadia Center, and other great organizations – and the anti-pipeline grassroots uprising!

34
What are the alternatives? Fix the gas leaks Energy Efficiency & Conservation Reduce the peak energy use - “Wait ‘til 8” Demand Response More efficient use of existing generation Timing of energy markets Storage o Battery o Flywheel o Compressed air or nitrogen (new tech) o Liquefied Natural Gas (LNG)
 o Liquefied Natural Gas (LNG).")
35
Natural Gas Not Clean Not Cheap Not Reliable Not Needed We Can Do Better. We already are!

36
www.thebeatnews.org Jane Winn jane@thebeatnews.org 413-230-7321jane@thebeatnews.org

37
Kinder Morgan Richard Kinder – Former COO of ENRON August 2014 - S&P said that with Kinder Morgan’s new financial structure “future debt leverage will be aggressive,” and predicted that Kinder could have a debt to EBITDA ratio of above 5.5x, “the highest in its peer group.”

38
3,000 pipeline – during construction 24,000 clean energy – full-time, permanent, local Clean energy employment now equals 2.4% of all workers in the Commonwealth, which is larger than the insurance industry in Massachusetts and about half the size of its well-established information technology sector. Clean energy activity is responsible for 2.5% of Massachusetts’ Gross State Product at about $10 billion. 2014 MASSACHUSETTS CLEAN ENERGY INDUSTRY REPORT by the MA Clean Energy Center JOBS

39
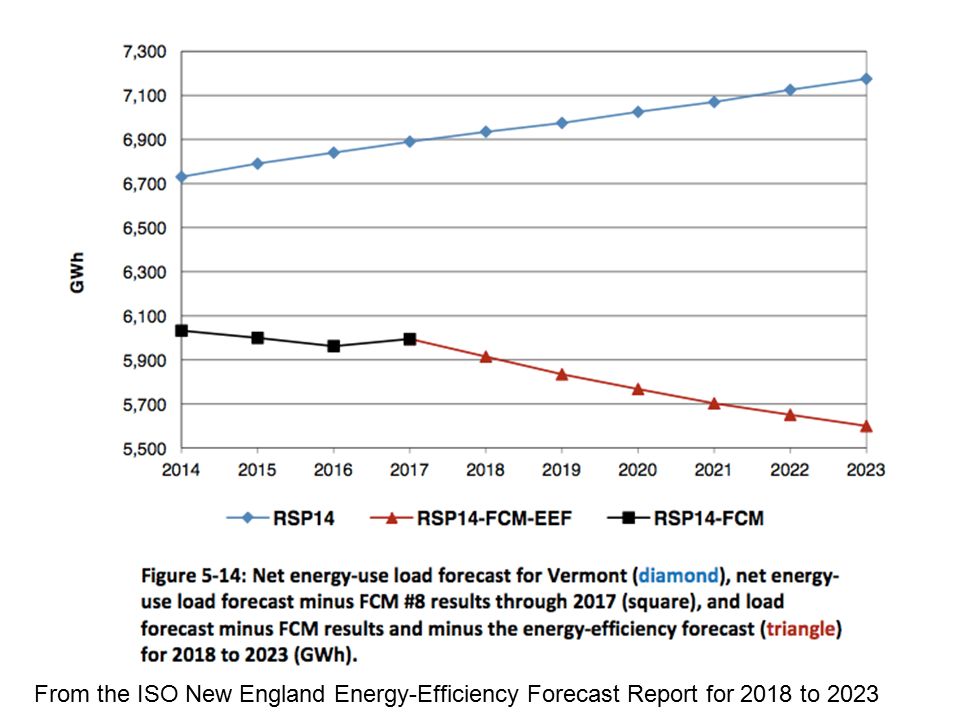
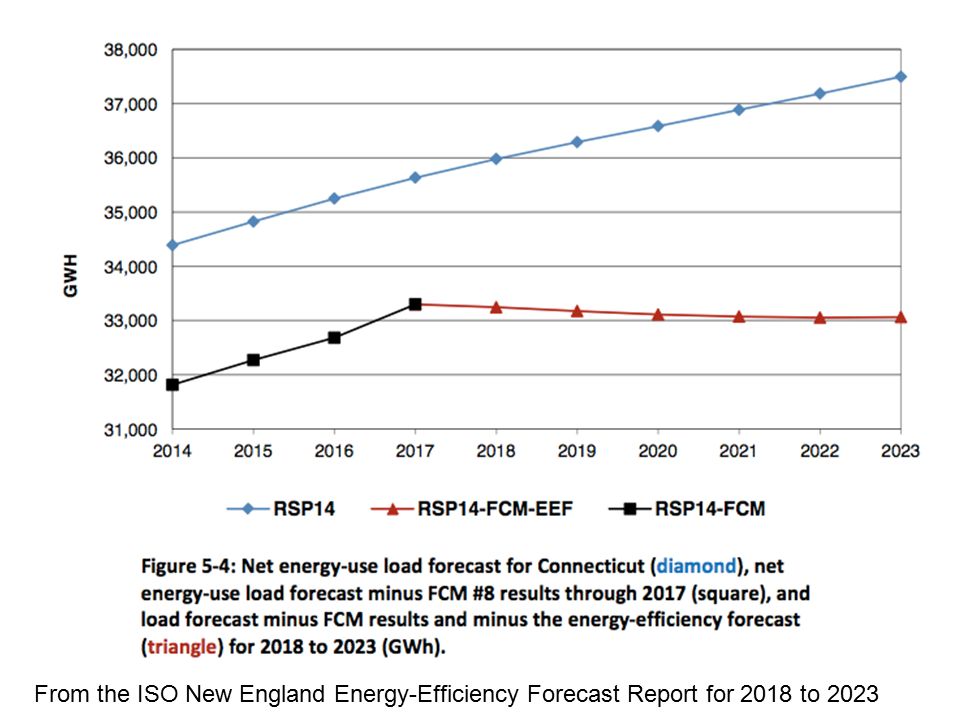
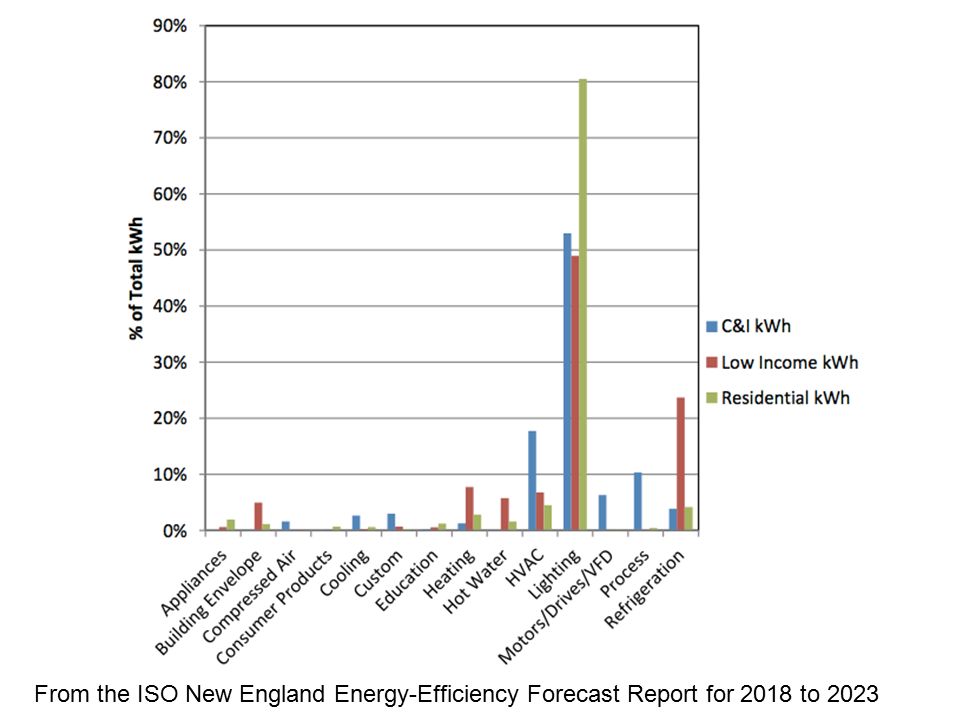
From the ISO New England Energy-Efficiency Forecast Report for 2018 to 2023

42
Other Alternatives Reduce the peak energy use (6-8pm) – “Wait ‘til 8” Demand Response – large users of electricity can bid in the electric market to allow ISO-NE to reduce their electricity during peak loads More efficient use of existing generation Timing of energy markets Storage Battery Flywheel Compressed air or nitrogen (new tech) Liquefied Natural Gas (LNG)
 – Wait ‘til 8 Demand Response – large users of electricity can bid in the electric market to allow ISO-NE to reduce their electricity during peak loads More efficient use of existing generation Timing of energy markets Storage Battery Flywheel Compressed air or nitrogen (new tech) Liquefied Natural Gas (LNG)")
43
So Why Not Use LNG? ISO-NE explicitly chose to rely solely on oil, knowing that it would result in higher electricity costs because it was concerned that “…an ISO solution [that] reduced the opportunity costs priced into the gas market during a time of high gas demand,... would lower gas prices and send the wrong signal about the relative scarcity of natural gas. These lower prices would also be reflected in the electricity market.” ISO-NE June 28, 2013 (FERC filing)
.")
44
Natural Gas Not Clean Not Cheap Not Reliable Not Needed We Can Do Better. We already are!

45
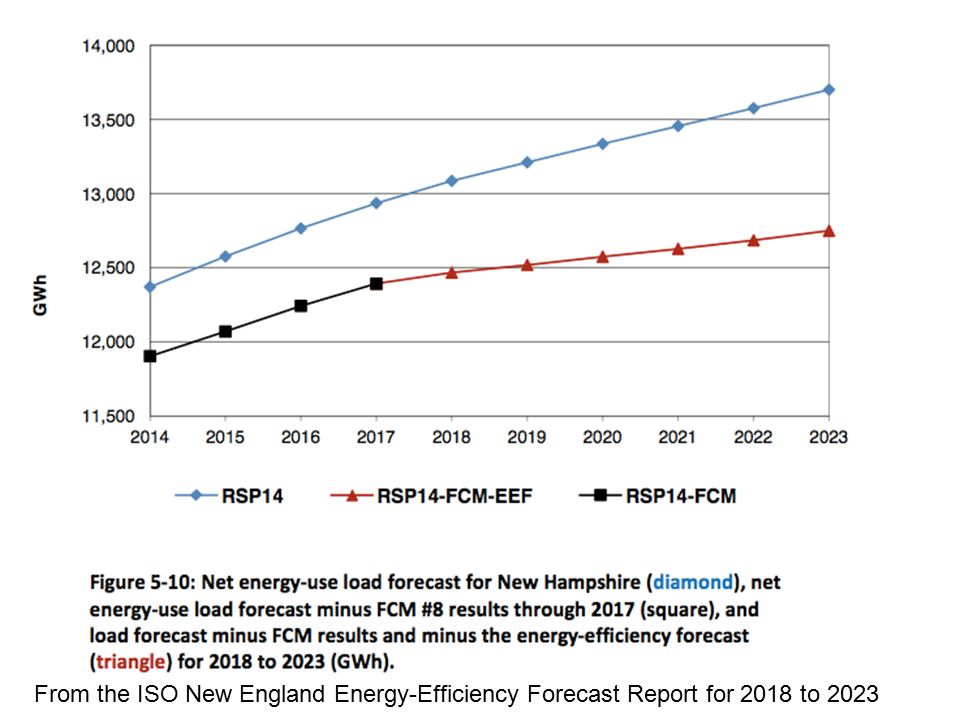
From the ISO New England Energy-Efficiency Forecast Report for 2018 to 2023

47
ISO New England 37,000 MW of electric capacity resources 28,130 MW all-time peak demand (Aug 2006) At any given time the ISO maintains a reserve capacity: 125% of the largest source of supply (10 min) 50% of the second largest source of supply (30 min) Electric ratepayers pay for keeping that extra capacity ready at all times
 At any given time the ISO maintains a reserve capacity: 125% of the largest source of supply (10 min) 50% of the second largest source of supply (30 min) Electric ratepayers pay for keeping that extra capacity ready at all times")
48
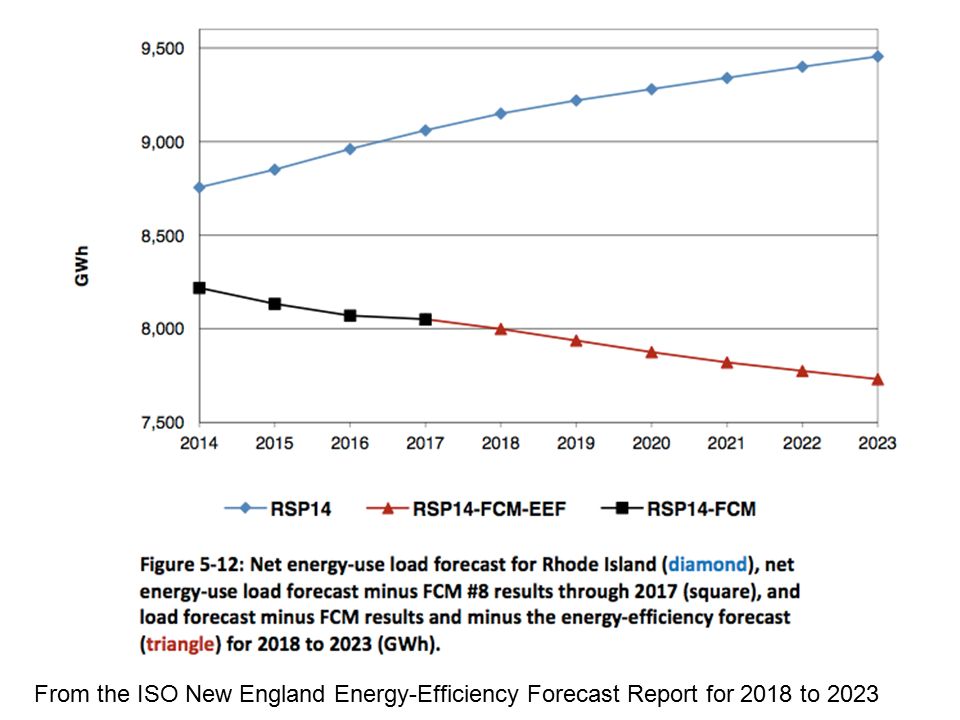
From the ISO New England Energy-Efficiency Forecast Report for 2018 to 2023

53
Ask for an Alternatives Analysis Fix the leaks Encourage further gains in energy efficiency Encourage further gains in renewables Reduce peak usage Make sure we meet our statutory obligations under the MA Global Warming Solutions Act

Similar presentations


 November 7th, 2006 Northwest Energy: A Look at the Past, Present and Future of Electricity Generation in the Pacific Northwest.>")


