Download presentation
Presentation is loading. Please wait.

1
A Quarter-Million High-Wage, High-Demand Jobs Brought to you by the Oregon Employment Department A Presentation to the Oregon State Board of Education Graham Slater January 18, 2008

2
Occupational Prioritization for Training A New and Comprehensive Approach to Oregon Workforce Planning A Presentation to the Oregon State Board of Education Graham Slater December 12, 2008

3
But first, a brief follow-up to my January presentation to you: Introducing our most recent special report: Working in Oregon … … Now and in the Future Oregon’s economy in 2008. Employment in Oregon: Preparing for the Likely Future Let’s Aim High for Oregon: 40-40-20 Education Goals

4
Now to the main focus of today’s presentation: Occupational Prioritization for Training (or OP4T as it’s becoming known). The dreaded question: “Can you give us a demand-supply analysis for every occupation in Oregon, so we can figure out which ones to fund training for?” The despised answer: “No.” A new approach: Reject the “one data set for all occupations” approach. Use the good data for all occupations. Use the questionable data only for occupations where it looks reasonably reliable.

5
A Four-Step Approach 1.Start with Oregon’s high-wage, high-demand occupations 2.Use six “strong data” factors to begin the prioritization of occupations. 3.Use four “weaker data / subjective” factors to refine the prioritization of occupations. 4.Encourage decision-makers to “dig deeper” into the highest priority occupations that are of most interest to them, working with subject matter experts in those occupations.

6
Step One – High-Wage, High-Demand Start with occupations on Oregon’s statewide high-wage (and) high-demand list. Pay more than the median wage ($15.22 per hour for the statewide list in 2007) AND Projected to have more than the median number of openings (283 in ten years for the statewide list in 2007) for all occupations in Oregon. Based on concepts and definitions approved by Oregon’s Workforce Investment Board in 2007. Add occupations that don’t make the statewide list but make at least five (of the 15) regional high-wage, high-demand lists. Step One narrows the focus from all occupations (721 in Oregon) to 269 that pay reasonably high wages and are expected to be in reasonably high demand.
 AND Projected to have more than the median number of openings (283 in ten years for the statewide list in 2007) for all occupations in Oregon. Based on concepts and definitions approved by Oregon’s Workforce Investment Board in Add occupations that don’t make the statewide list but make at least five (of the 15) regional high-wage, high-demand lists. Step One narrows the focus from all occupations (721 in Oregon) to 269 that pay reasonably high wages and are expected to be in reasonably high demand..")
7
Step Two – Six Strong Data Factors Give the 269 occupations scores based on the following characteristics: Total (growth plus replacement) openings Relative occupational need 2008 average wage Number of vacancies Duration of vacancies Geographic diversity of need
 openings Relative occupational need 2008 average wage Number of vacancies Duration of vacancies Geographic diversity of need")
8
Step Two – Six Strong Data Factors Methodology for scoring: List the occupations in a sort from highest to lowest (e.g. most openings to fewest openings; highest wage to lowest wage) Identify the quintiles Give those occupations in the top quintile (e.g. those with the most openings) a value of 5, those in the next group a value of 4, and so on down to the last quintile, which will get a value of 1. Sum each occupation’s scores for each of the six factors. At the end of this step, Oregon’s 269 high-wage, high-demand occupations each have a composite (additive) score ranging from 30 (for an occupation that was in the top quintile for all of the above measures) to 6 (for an occupation in the lowest quintile for all measures).
 Identify the quintiles Give those occupations in the top quintile (e.g. those with the most openings) a value of 5, those in the next group a value of 4, and so on down to the last quintile, which will get a value of 1. Sum each occupation’s scores for each of the six factors. At the end of this step, Oregon’s 269 high-wage, high-demand occupations each have a composite (additive) score ranging from 30 (for an occupation that was in the top quintile for all of the above measures) to 6 (for an occupation in the lowest quintile for all measures)..")
9
Step Three – Four Important Considerations Impact of immigration Impact of supply / pipeline shortages Business affirmation of the workforce need Links to “key” industries

10
Step Three – Four Important Considerations Methodology for scoring: Give each factor a starting value of 1.0. Change that factor only if reasonably reliable data or other information provide a valuable insight for a particular occupation. Migration factors range from 0.9 to 1.1; supply-demand factors range from 0.7 to 1.3; key industries and business affirmation factors range from 1.0 to 1.1. Multiply each occupation’s “Step Two” score by each of these four factors. At the end of this step, Oregon’s 269 high-wage, high-demand occupations each have a composite (additive and multiplicative) score with a possible range from about 52 to about 3.
 score with a possible range from about 52 to about 3..")
11
Step Four – Conversation with Experts is Essential The data can only take you so far. Based on the prioritization created from steps 1-3, talk to subject matter experts, and learn more about things like: Why is the occupation expected to need additional training? Are certain skills particularly in need? Is the occupational shortage caused by factors other than the supply of trained workers? Is the occupation impacted by specific training, education, certifications, or skills requirements? Are there barriers to additional training such as lack of equipment, faculty, or internships? Are there opportunities for positive steps that would attract additional students toward particular occupations, such as scholarships or other incentives?

12
Exceptions are Allowed The Governor, other elected officials, Workforce Boards, other Boards and Commissions are elected or appointed to make important policy decisions. Our hope is that this prioritization model, as it is used, and perhaps modified and improved over time, would become a valuable driver for many, even most, workforce training- related resource prioritization decisions. But we also completely accept the fact that the above entities, and others like them, must retain the right to make policy choices based on exceptions to this process.

13
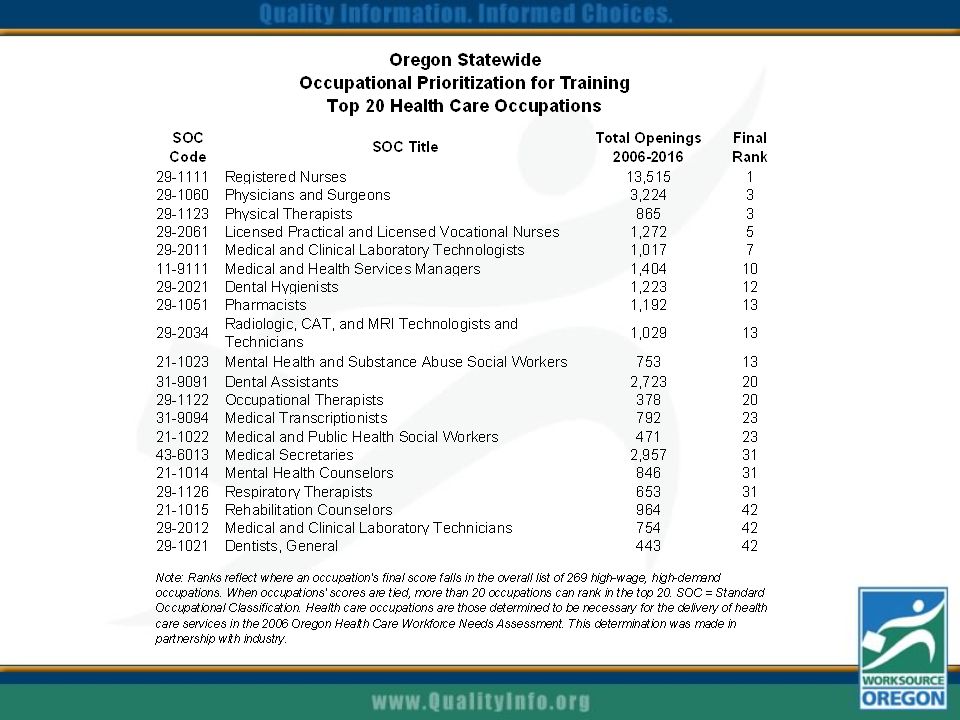
A Method for Many Purposes As described thus far, this method can be used to prioritize perceived training needs across all of Oregon’s occupations. But with the addition of information linking each occupation to key industries, clusters, economic development or other strategies, it could be used to prioritize perceived training needs within particular groups of occupations. e.g. health care, manufacturing, clean tech, traded sector, apprentice- able.

17
Next Steps Already shared with numerous agency heads, Workforce Policy Cabinet, Oregon Workforce Investment Board. November: Develop regional prioritizations Develop on-line tool December: Present to Oregon State Board of Education Release on-line tool January Publish special report

18
Please contact us if you have any comments or questions about this presentation. And please visit our web site – www.QualityInfo.org – for more information about Oregon’s economy and workforce.www.QualityInfo.org Graham Slater Graham.J.Slater@state.or.us (503) 947-1212 Jessica Nelson Jessica.R.Nelson@state.or.us (503) 947-1276
 Jessica Nelson (503)")
Similar presentations


 initiative. Includes.>")


 Denis Hart.>")

 Instructor : Dr. Abed Al-Majed Nassar 2009-2010.>")
 was created as a result of P.A. 04- 220 (An Act Concerning Allied Health Needs) to conduct.>")


>")


 Florida’s Adult Education Career Pathways December 2012 Tallahassee,>")


