Download presentation
Presentation is loading. Please wait.

1
The Evolving Credit Crisis #2 – May 2012 Daryl Montgomery May 22, 2012 Copyright 2012, All Rights Reserved The contents of this presentation are not intended as a recommendation to buy or sell any security.

2
Europe on Verge of Implosion Debt/Banking Crisis in Europe accelerates and is now moving to Spain. - Spanish 10-years have hit 6.35%, Italy hits 6% - Runs on entire banking system in Greece, Bankia in Spain (+JPMorgan problem) - Moodys downgrades Spanish banks. - Spain nationalizes Bankia. New Greek election in June, anti-bailout party likely to win. Socialists win in France. LTROs have filled the EU banks with junk debt of peripheral countries (PIIGS).
 - Moodys downgrades Spanish banks. - Spain nationalizes Bankia. New Greek election in June, anti-bailout party likely to win. Socialists win in France. LTROs have filled the EU banks with junk debt of peripheral countries (PIIGS)..")
3
History of EU Country Borrowing Rates

4
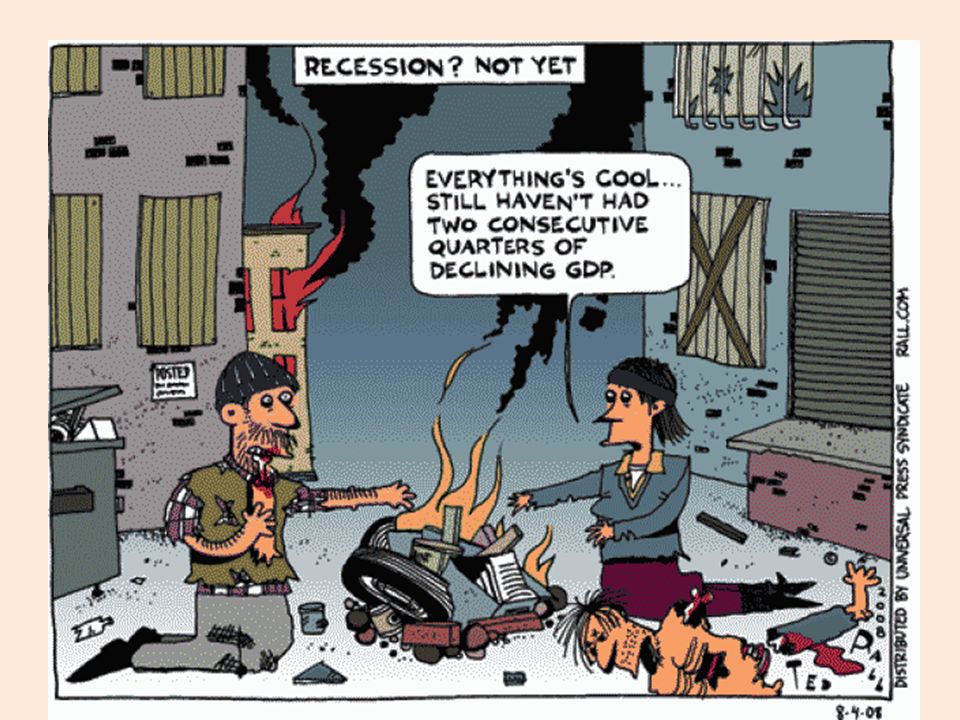
Economies Faltering Official GDP growth for EU in Q1was 0%. UK and at lease 8 other EU countries are officially in a recession. China GDP 8.1% in Q1, 7.9% predicted for Q2. Japan GDP up 4.1% in Q1 (govt auto subsidies). U.S. GDP up 2.1% in Q1 (subtract 3%). - April Jobs up 115,000, unemployment 8.1% (labor force down 10 million in 5 years). - Retail Sales up 0.1% in April (with inflation). - ISM Manufacturing up, Services decrease.
. U.S. GDP up 2.1% in Q1 (subtract 3%). - April Jobs up 115,000, unemployment 8.1% (labor force down 10 million in 5 years). - Retail Sales up 0.1% in April (with inflation). - ISM Manufacturing up, Services decrease..")
5
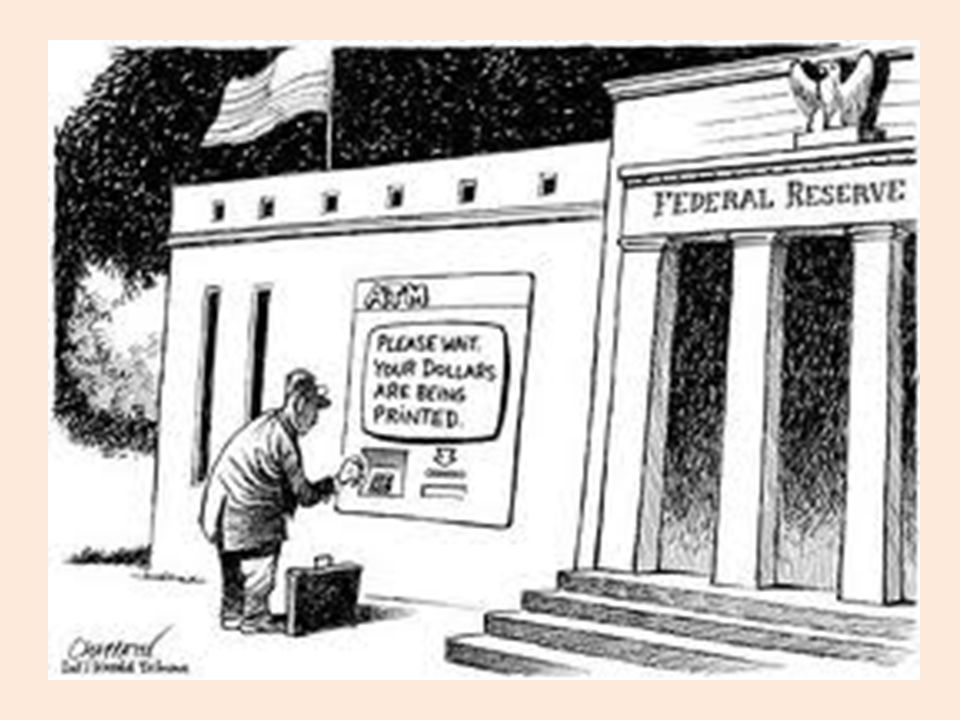
Monetary Policy Worldwide Central Bank Interest Rates: - U.S. and Japan close to 0.0% - UK at 0.5% - ECB at 1.0% Fed doing Operation Twist and dollar swaps. BOE still on QE2. ECB balance Sheet increases more than Feds (China bigger still, cuts bank reserves). BOJ bought record amount of ETFs. U.S. Monetary Base pauses after 3 exponential increases, money supply keeps rising.
. BOJ bought record amount of ETFs. U.S. Monetary Base pauses after 3 exponential increases, money supply keeps rising..")
6
Summary of 2012 Monetary Policy

7
Debt by Country

8
U.S. Monetary Base

9
Money Supply MZM

10
Dollar Swap Lines Demand coming from EU and Japan.

11
ECB, Fed, China, Japan Balance Sheets

12
ECB, Fed Balance Sheets vs S&P 500

13
Fed Balance Sheet

15
National Debt: $15.7 trillion State and Local Debt $2.8 trillion Unfunded liabilities $119 trillion. Debt to GDP ratio >104% (actually much greater). Debt doesnt include Federal Reserve or Fannie Mae, Freddie Mac and FHA obligations. Debt Ceiling at $16.4 trillion. Will be hit in September/October (not after election). Federal budget deficit for 2012 at least $1.3 trillion. California at $17 billion. 2012 Trade Deficit could reach $700 billion. U.S. Fiscal State
. Debt doesnt include Federal Reserve or Fannie Mae, Freddie Mac and FHA obligations. Debt Ceiling at $16.4 trillion. Will be hit in September/October (not after election). Federal budget deficit for 2012 at least $1.3 trillion. California at $17 billion Trade Deficit could reach $700 billion. U.S. Fiscal State.")
17
This Years GDP Revisions Compared to Last Year Blue line original numbers. Red line revised numbers.

18
Shadowstats.com and Reported U.S. CPI

Similar presentations