Download presentation
Presentation is loading. Please wait.

1
Construction Industry Snapshot and Forecast by Mike Eby, Editor-in-Chief EC&M magazine

2
Phrases you don’t really want to use as ice breakers at a holiday party Stalled recovery Stalled recovery Expiration of incentives Expiration of incentives Budget shortfall Budget shortfall Flat forecast Flat forecast Double dip recession Double dip recession

3
Current State of Affairs Economic indicators seem to be moving in the right direction, but progress is excruciatingly slow Economic indicators seem to be moving in the right direction, but progress is excruciatingly slow Many of the key data points have bounced off the bottoms they experienced during the recession, but are struggling to gain any momentum Many of the key data points have bounced off the bottoms they experienced during the recession, but are struggling to gain any momentum

4
Housing Starts Dipped 0.3% in October as compared to prior month, but was up 17% as compared to October 2010 level Dipped 0.3% in October as compared to prior month, but was up 17% as compared to October 2010 level Single-family starts climbed 3.9% for the month, but dropped 0.9% year-over-year Single-family starts climbed 3.9% for the month, but dropped 0.9% year-over-year Multi-family dropped 8.3% for the month, but is still 89% higher from a very low October 2010 level Multi-family dropped 8.3% for the month, but is still 89% higher from a very low October 2010 level Source: U.S. Census Bureau

5
Building Permits Up 11% in October and 18% year-over- year Up 11% in October and 18% year-over- year Single-family up 5.1% for the month and 6.6% year-over-year Single-family up 5.1% for the month and 6.6% year-over-year Multi-family up 24% for the month and 48% year-over-year Multi-family up 24% for the month and 48% year-over-year Source: U.S. Census Bureau

6
Residential Remodeling The BuildFax Remodeling Index is based on construction permits filed with local building departments across the country The BuildFax Remodeling Index is based on construction permits filed with local building departments across the country Index rose 34% year-over-year in September to 141.4, a new high. Index rose 34% year-over-year in September to 141.4, a new high. Up month-over-month 2.8 points (2%) from the August value of 138.6 Up month-over-month 2.8 points (2%) from the August value of 138.6 Up year-over-year 36.3 points from the September 2010 value of 105.1 Up year-over-year 36.3 points from the September 2010 value of 105.1 National numbers appear to be skewed by lots of activity in the West region of the country National numbers appear to be skewed by lots of activity in the West region of the country Source: BUILDERadius
 from the August value of Up month-over-month 2.8 points (2%) from the August value of Up year-over-year 36.3 points from the September 2010 value of Up year-over-year 36.3 points from the September 2010 value of National numbers appear to be skewed by lots of activity in the West region of the country National numbers appear to be skewed by lots of activity in the West region of the country Source: BUILDERadius.")
7
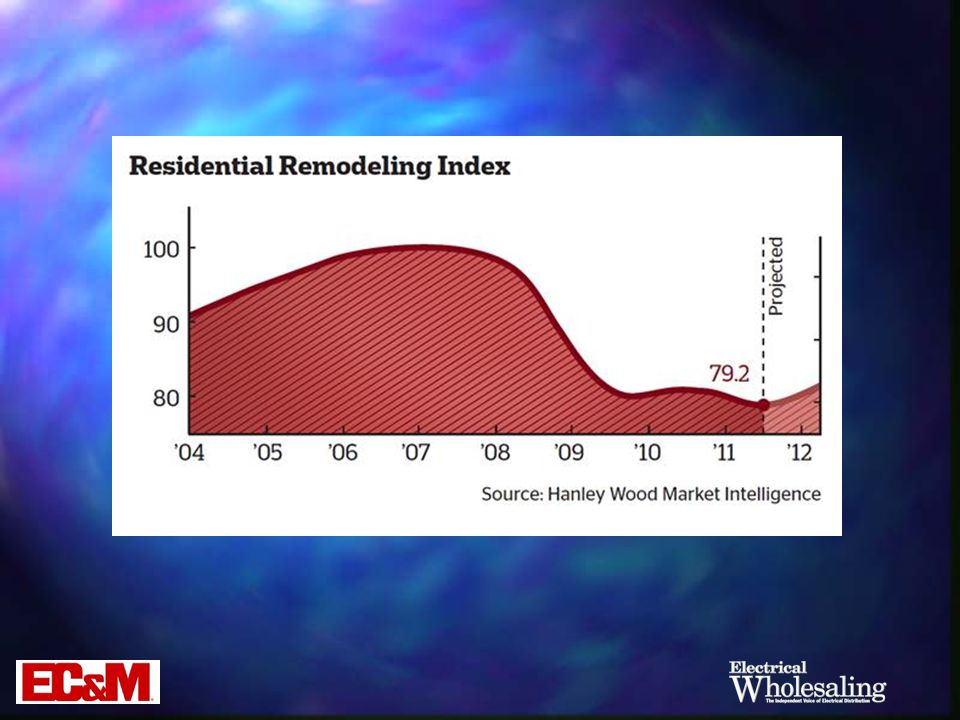
Residential Remodeling The Residential Remodeling Index (RRI) is a quarterly measure of remodeling activity in 336 metropolitan statistical areas in the U.S. The Residential Remodeling Index (RRI) is a quarterly measure of remodeling activity in 336 metropolitan statistical areas in the U.S. 3 rd quarter RRI declined 0.8% from 2 nd quarter 3 rd quarter RRI declined 0.8% from 2 nd quarter October forecast calling for minor decline in 4 th quarter October forecast calling for minor decline in 4 th quarter Source: Hanley Wood
 is a quarterly measure of remodeling activity in 336 metropolitan statistical areas in the U.S. 3 rd quarter RRI declined 0.8% from 2 nd quarter 3 rd quarter RRI declined 0.8% from 2 nd quarter October forecast calling for minor decline in 4 th quarter October forecast calling for minor decline in 4 th quarter Source: Hanley Wood.")
9
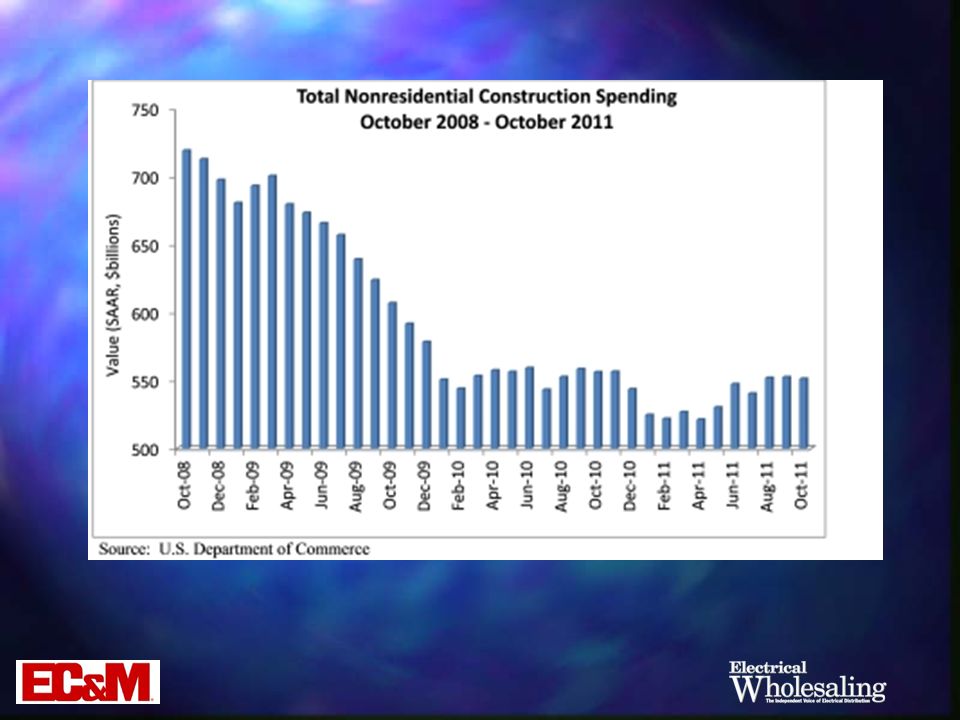
Non-Residential Construction Spending Fell 0.2% in October to seasonally adjusted annual rate of $551.2 billion, according to U.S. Census Bureau Fell 0.2% in October to seasonally adjusted annual rate of $551.2 billion, according to U.S. Census Bureau Down 0.9% from one year ago Down 0.9% from one year ago Private non-resi spending was up 1.3% this month and is 8.4% higher than a year ago Private non-resi spending was up 1.3% this month and is 8.4% higher than a year ago Public non-resi spending was down 1.8% for the month and down 8.9% from a year ago Public non-resi spending was down 1.8% for the month and down 8.9% from a year ago Source: U.S. Department of Commerce

10
Non-Residential Construction Spending (cont’d) Four subsectors realized higher spending levels from same time last year Four subsectors realized higher spending levels from same time last year Manufacturing (+13.3%) Manufacturing (+13.3%) Power (+12.6%) Power (+12.6%) Commercial (+10.0) Commercial (+10.0) Educational (+2.6%) Educational (+2.6%) Source: U.S. Department of Commerce

12
Non-Residential Construction Spending (cont’d) “For months, the non-resi construction industry has been characterized by rising levels of privately financed construction and declining levels of publicly financed construction.” “For months, the non-resi construction industry has been characterized by rising levels of privately financed construction and declining levels of publicly financed construction.” “Construction volume may slip for several months before stabilizing and beginning a sustained recovery in earnest.” “Construction volume may slip for several months before stabilizing and beginning a sustained recovery in earnest.” Anirban Basu, Chief Economist, Associated Builders and Contractors Source: Anirban Basu, Chief Economist, Associated Builders and Contractors
 For months, the non-resi construction industry has been characterized by rising levels of privately financed construction and declining levels of publicly financed construction. For months, the non-resi construction industry has been characterized by rising levels of privately financed construction and declining levels of publicly financed construction. Construction volume may slip for several months before stabilizing and beginning a sustained recovery in earnest. Construction volume may slip for several months before stabilizing and beginning a sustained recovery in earnest. Anirban Basu, Chief Economist, Associated Builders and Contractors Source: Anirban Basu, Chief Economist, Associated Builders and Contractors")
13
Capacity Utilization Measures current output versus potential output at U.S. factories Measures current output versus potential output at U.S. factories 80% rate is considered the tipping point where factories begin expanding their facilities or retrofitting existing lines 80% rate is considered the tipping point where factories begin expanding their facilities or retrofitting existing lines Dropped to a level of about 70% in 2009 and now sits at about 76% Dropped to a level of about 70% in 2009 and now sits at about 76% Hey, we’re moving in the right direction! Hey, we’re moving in the right direction! Source: Federal Reserve Board

14
Purchasing Manager’s Index Measures the appetite that industrial purchasing manager’s have for new products (a reading above 50 indicates a healthy purchasing environment) Measures the appetite that industrial purchasing manager’s have for new products (a reading above 50 indicates a healthy purchasing environment) Posted a November reading of 52.7% (October reading was 50.8%) Posted a November reading of 52.7% (October reading was 50.8%) Readings have indicated an expanding market for 28 consecutive months Readings have indicated an expanding market for 28 consecutive months Source: Institute for Supply Management
 Measures the appetite that industrial purchasing manager’s have for new products (a reading above 50 indicates a healthy purchasing environment) Posted a November reading of 52.7% (October reading was 50.8%) Posted a November reading of 52.7% (October reading was 50.8%) Readings have indicated an expanding market for 28 consecutive months Readings have indicated an expanding market for 28 consecutive months Source: Institute for Supply Management")
15
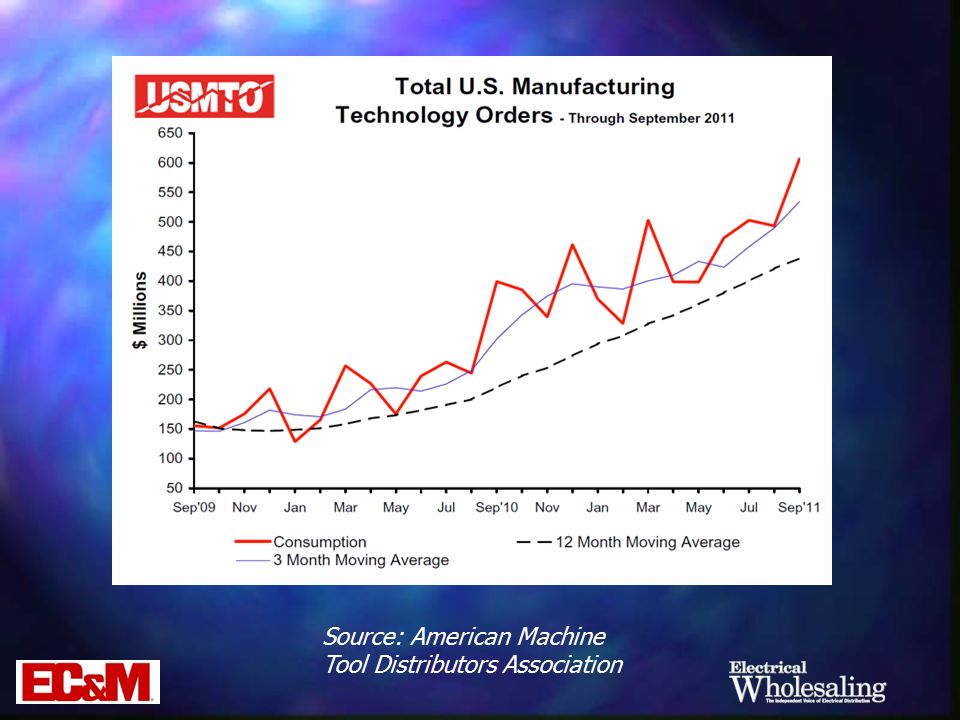
Machine Tool Orders A pure indicator of the health of industrial businesses A pure indicator of the health of industrial businesses Hit a level of $606.6 million in September, which was the second highest monthly dollar total in the last 15 years! Hit a level of $606.6 million in September, which was the second highest monthly dollar total in the last 15 years! Year-to-date total of $4.1 billion is up 91.9% as compared with 2010 Year-to-date total of $4.1 billion is up 91.9% as compared with 2010 Source: American Machine Tool Distributors Association

17
Electrical Manufacturer’s New Orders New orders have been flat this year, but fairly steady New orders have been flat this year, but fairly steady Up 5% year-to-date through September at a level of $3.87 billion Up 5% year-to-date through September at a level of $3.87 billion Also up approximately 5% year-to-year Also up approximately 5% year-to-year Source: U.S. Department of Commerce

18
Business Conditions Survey Latest Electroindustry Business Confidence Index on current conditions reflects optimism Latest Electroindustry Business Confidence Index on current conditions reflects optimism November reading at 56 November reading at 56 Future reading continues to point in a positive direction (looking 6 months into the future) Future reading continues to point in a positive direction (looking 6 months into the future) November reading at 60 November reading at 60 Source: NEMA
 Future reading continues to point in a positive direction (looking 6 months into the future) November reading at 60 November reading at 60 Source: NEMA")
19
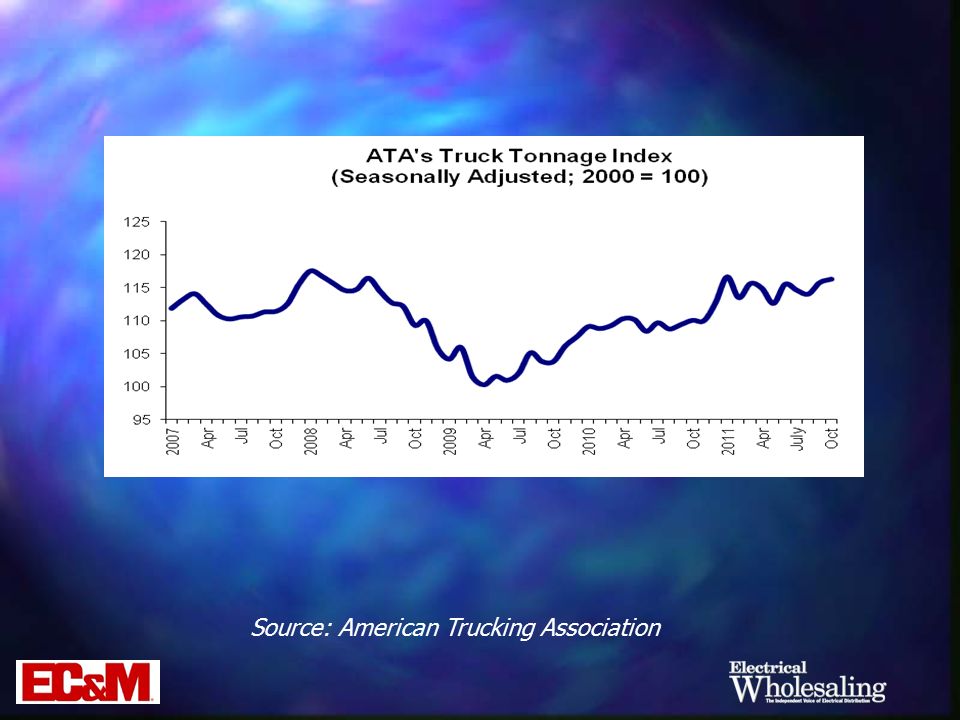
Truck Tonnage Index Trucking serves as a barometer of the U.S. economy, representing 67.2% of tonnage carried by all modes of domestic freight transportation, including manufactured and retail goods. Trucking serves as a barometer of the U.S. economy, representing 67.2% of tonnage carried by all modes of domestic freight transportation, including manufactured and retail goods. Tonnage readings continue to show that economy is growing and not sliding back into recession Tonnage readings continue to show that economy is growing and not sliding back into recession Source: American Trucking Association

20
Truck Tonnage Index Index increased 0.5% in October Index increased 0.5% in October Up 5.7% from one year ago Up 5.7% from one year ago October’s tonnage reading was just 4.4% below the index’s all-time high in January 2005. October’s tonnage reading was just 4.4% below the index’s all-time high in January 2005. Source: American Trucking Association

22
So where do we go from here?

23
A View From the Distributor Side of the House

24
DISC Analysis This year started off strong, led by a surge in the industrial market (+20% in the 1st quarter). Growth should remain steady through the remainder of this year. This year started off strong, led by a surge in the industrial market (+20% in the 1st quarter). Growth should remain steady through the remainder of this year. Total electrical industry sales should end the year about 9% higher than last year. Total electrical industry sales should end the year about 9% higher than last year. However, if we take out about a 7% price factor, we’re really only up about 2% in physical volume. However, if we take out about a 7% price factor, we’re really only up about 2% in physical volume. Source: Distributor Information Services Corp.
. Growth should remain steady through the remainder of this year. Total electrical industry sales should end the year about 9% higher than last year. Total electrical industry sales should end the year about 9% higher than last year. However, if we take out about a 7% price factor, we’re really only up about 2% in physical volume. However, if we take out about a 7% price factor, we’re really only up about 2% in physical volume. Source: Distributor Information Services Corp..")
25
DISC Outlook 2012 is fraught with uncertainty 2012 is fraught with uncertainty Project strong growth in residential market, with a huge upturn in 2013 Project strong growth in residential market, with a huge upturn in 2013 Commercial and industrial to flatten out Commercial and industrial to flatten out In other words, look for another year of belt tightening In other words, look for another year of belt tightening Source: Distributor Information Services Corp.

26
DISC Outlook Growth rate in 2013 could be as high as 7%, followed by double digit increase in the 2014-2015 Growth rate in 2013 could be as high as 7%, followed by double digit increase in the 2014-2015 Over the five year period between 2010 and 2015, electrical industry distributor sales will grow close to 10% annual rate Over the five year period between 2010 and 2015, electrical industry distributor sales will grow close to 10% annual rate Source: Distributor Information Services Corp.

27
Electrical Wholesaling ’s Outlook EW’s Top 200 electrical distributors forecast a 5.1% increase in sales next year EW’s Top 200 electrical distributors forecast a 5.1% increase in sales next year It’s interesting to note, however, that of the 236 distributors who provided a sales forecast, 41% expect their sales to stay the same It’s interesting to note, however, that of the 236 distributors who provided a sales forecast, 41% expect their sales to stay the same

28
A View From the Manufacturing Sector

29
Manufacturing Production Outlook Investment in business equipment and increased exports will be economic driver for next 5 years Investment in business equipment and increased exports will be economic driver for next 5 years Manufacturing production growth rates: Manufacturing production growth rates: 2011 – 4.3% 2011 – 4.3% 2012 – 3.4 % 2012 – 3.4 % 2013 – 3.8% 2013 – 3.8% Source: Manufacturers Alliance for Productivity and Innovation

30
Manufacturing Production Outlook (cont’d) Expect a net increase in hiring: Expect a net increase in hiring: 2011 – 230,000 jobs 2011 – 230,000 jobs 2012 – 170,000 jobs 2012 – 170,000 jobs 2013 – 140,000 jobs 2013 – 140,000 jobs Project industrial equipment expenditures to advance by: Project industrial equipment expenditures to advance by: 12.1% in 2011 12.1% in 2011 10% in 2012 10% in 2012 5.2% in 2013 5.2% in 2013 Source: Manufacturers Alliance for Productivity and Innovation
 Expect a net increase in hiring: Expect a net increase in hiring: 2011 – 230,000 jobs 2011 – 230,000 jobs 2012 – 170,000 jobs 2012 – 170,000 jobs 2013 – 140,000 jobs 2013 – 140,000 jobs Project industrial equipment expenditures to advance by: Project industrial equipment expenditures to advance by: 12.1% in % in % in % in % in % in 2013 Source: Manufacturers Alliance for Productivity and Innovation")
31
A View From the Home Builders

32
Housing Starts Good news Good news Forecast calls for double-digit increases in 2012 for the total market (+14.9%) Forecast calls for double-digit increases in 2012 for the total market (+14.9%) Single family units (+16.8%) Single family units (+16.8%) Multi-family units (+10.3%) Multi-family units (+10.3%) Bad news? Bad news? Last year’s forecast called for even bigger increases, which never materialized Last year’s forecast called for even bigger increases, which never materialized Source: National Association of Home Builders

33
Housing Starts (single-family) Predict starts to hit 495,000 units in 2012 and 723,000 units in 2013 Predict starts to hit 495,000 units in 2012 and 723,000 units in 2013 Feels current level is merely maintaining housing stock Feels current level is merely maintaining housing stock However, at this time last year they predicted a 33% rebound for 2011 However, at this time last year they predicted a 33% rebound for 2011
 Predict starts to hit 495,000 units in 2012 and 723,000 units in 2013 Predict starts to hit 495,000 units in 2012 and 723,000 units in 2013 Feels current level is merely maintaining housing stock Feels current level is merely maintaining housing stock However, at this time last year they predicted a 33% rebound for 2011 However, at this time last year they predicted a 33% rebound for 2011")
34
Housing Starts (multi-family) Following a strong showing this year, NAHB predicts starts to improve another 13% and 14% in 2012 and 2013 Following a strong showing this year, NAHB predicts starts to improve another 13% and 14% in 2012 and 2013
 Following a strong showing this year, NAHB predicts starts to improve another 13% and 14% in 2012 and 2013 Following a strong showing this year, NAHB predicts starts to improve another 13% and 14% in 2012 and 2013")
35
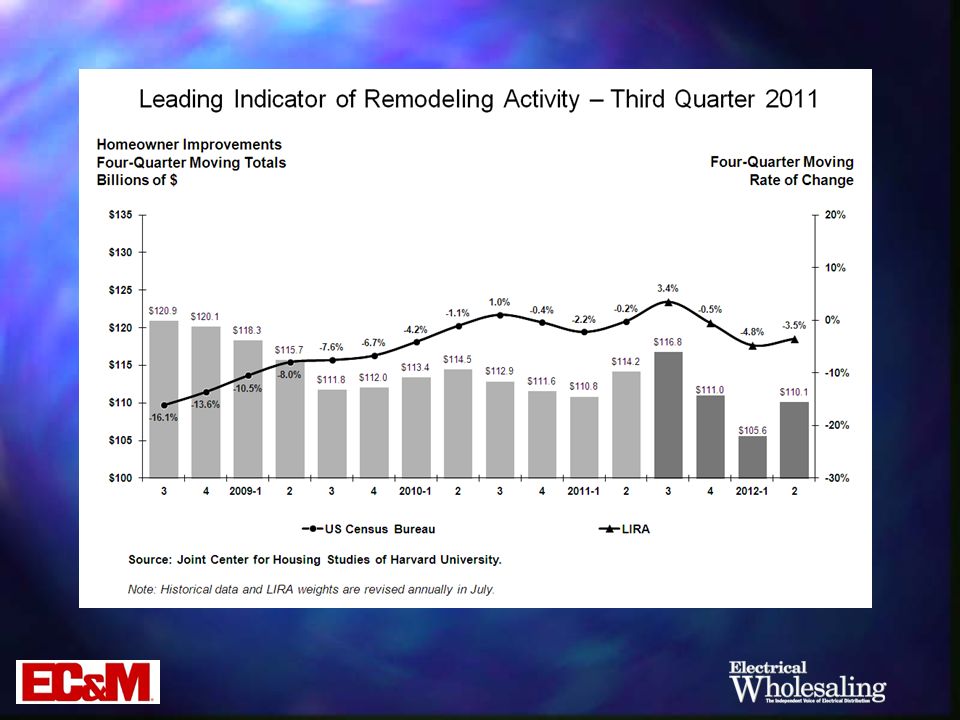
Residential Remodeling Outlook A sluggish economy and housing market will continue to hamper home improvement spending well into next year, according to the Leading Indicator of Remodeling Activity (LIRA) A sluggish economy and housing market will continue to hamper home improvement spending well into next year, according to the Leading Indicator of Remodeling Activity (LIRA) The remodeling market is expected to stay soft with the LIRA pointing to a modest decline in annual homeowner improvement spending over the next several quarters. The remodeling market is expected to stay soft with the LIRA pointing to a modest decline in annual homeowner improvement spending over the next several quarters. Source: Joint Center for Housing Studies, Harvard University

37
A View From a Lodging Industry Market Analyst

38
Hotel Construction Projects under construction remain at cyclical lows Projects under construction remain at cyclical lows Scheduled starts in the next 12 months fell below the 100,000 rooms level for the first time in memory Scheduled starts in the next 12 months fell below the 100,000 rooms level for the first time in memory Scheduled starts are expected to trend further downward Scheduled starts are expected to trend further downward Source: Lodging Econometrics

39
A View From the Associated Builders and Contractors Association

40
Private Up, Public Down ABC expects 2012 to be a year of gradual progress ABC expects 2012 to be a year of gradual progress Advances in private construction are partially offset by ongoing declines in publicly financed construction Advances in private construction are partially offset by ongoing declines in publicly financed construction Following a 2.4% decrease this year, non- residential construction spending is expected to grow 2.4% Following a 2.4% decrease this year, non- residential construction spending is expected to grow 2.4% Source: Associated Builders & Contractors

41
Indicator20102011*2012* % Change 2011-2012 Construction Spending – (millions, seasonally adjusted annual rate) - U.S. Census Bureau Total Nonresidential Lodging $11,329 $8,514$9,0256% Office $37,573 $34,181$36,5056.8% Commercial $40,522 $43,447$46,5757.2% Health Care $39,879 $40,621$43,8718.0% Educational $88,227 $85,359$81,945-4.0% Power $78,540 $87,519$95,3969.0% Manufacturing $38,106 $35,636$38,4878.0% Total - All Industries $554,915 $541,599$554,4142.4% Private Nonresidential Lodging $10,904 $7,976$8,4556% Office $24,231 $22,315$24,2508.7% Commercial $37,647 $39,988$43,0507.7% Health Care $30,316 $29,575$31,9608.1% Educational $13,356 $13,424$13,400-0.2% Power $66,601 $75,105$82,0009.2% Manufacturing $37,478 $34,956$37,7538% Total - All Industries $261,796 $263,538$281,8366.9% Public Nonresidential Office $13,342 $11,866$12,2553.3% Commercial $2,876 $3,459$3,5251.9% Health Care $9,562 $11,046$11,9117.8% Educational $74,871 $71,935$68,545-4.7% Power $11,939 $12,414$13,3967.9% Total - All Industries $293,119 $278,060$272,578-2% Source: Associated Builders & Contractors

42
A View From the Portland Cement Association

43
Softening Their Stance Last summer, the PCA thought total construction put-in-place figures would decline 4.9% this year and increase 1.8% in 2012 Last summer, the PCA thought total construction put-in-place figures would decline 4.9% this year and increase 1.8% in 2012 They have now downgraded their outlook to flat in 2012 and said “real growth may not appear until after 2013” They have now downgraded their outlook to flat in 2012 and said “real growth may not appear until after 2013” Source: Portland Cement Association

44
A View From Reed Construction Data

45
As a Whole RCD projects a 2.9% decline in total spending this year as national economy continues to struggle through period of slow growth RCD projects a 2.9% decline in total spending this year as national economy continues to struggle through period of slow growth Assuming no secondary recession, RCD forecasts total construction spending to: Assuming no secondary recession, RCD forecasts total construction spending to: increase 3.9% in 2012, and increase 3.9% in 2012, and increase 6.8% in 2013 increase 6.8% in 2013 Source: Reed Construction Data

46
U.S. Total Construction Spending (billions of U.S. current dollars) ActualForecast 200820092010201120122013 New Residential 237.0141.2136.2128.6132.4142.1 Year-over-year % Change -34.3%-40.4%-3.5%-5.6%2.9%7.3% Residential Improvements* 120.7112.7112.5112.8110.3115.2 -13.5%-6.6%-0.2%0.3%-2.2%4.5% Nonresidential Building 437.7375.7288.9276.0290.0314.0 8.4%-14.2%-23.1%-4.5%5.1%8.3% Heavy Engineering (Non-Builidng) 272.1273.5266.0263.3278.5294.8 9.7%0.5%-2.8%-1.0%5.8%5.9% Total**1,067.6903.2803.6780.7811.1866.1 -7.4%-15.4%-11.0%-2.9%3.9%6.8% *Residential Improvements include remodeling, renovation and replacement work. Number also includes RCD estimate of improvements to public housing. **Total may not equal the sum of its components due to rounding. Source: Census Bureau, U.S. Department of Commerce. Forecast: Reed Construction Data.
 ActualForecast New Residential Year-over-year % Change -34.3%-40.4%-3.5%-5.6%2.9%7.3% Residential Improvements* %-6.6%-0.2%0.3%-2.2%4.5% Nonresidential Building %-14.2%-23.1%-4.5%5.1%8.3% Heavy Engineering (Non-Builidng) %0.5%-2.8%-1.0%5.8%5.9% Total**1, %-15.4%-11.0%-2.9%3.9%6.8% *Residential Improvements include remodeling, renovation and replacement work. Number also includes RCD estimate of improvements to public housing. **Total may not equal the sum of its components due to rounding. Source: Census Bureau, U.S. Department of Commerce. Forecast: Reed Construction Data..")
47
Residential Sector RCD outlook is for slow, but steady improvement in residential construction RCD outlook is for slow, but steady improvement in residential construction Single-family permits have been trending up for the past eight months Single-family permits have been trending up for the past eight months Lean inventories mean any increase in demand will quickly translate to construction activity Lean inventories mean any increase in demand will quickly translate to construction activity Forecast is for residential spending to: Forecast is for residential spending to: Fall 5.6% in 2011 Fall 5.6% in 2011 Rise 2.9% in 2012 Rise 2.9% in 2012 Rise 7.3% in 2013 Rise 7.3% in 2013 Source: Reed Construction Data

48
Residential Construction Data ActualForecast 200820092010201120122013 Total Starts906554587596646743 -33.2%-38.8%5.9%1.6%8.3%15.1% Total Single-family Starts 622445471422434476 -40.5%-28.4%5.9%-10.4%2.9%9.6% Total Multifamily Starts 284109116174211268 -8.3%-61.6%6.2%50.4%21.4%26.6% Residential Construction Spending (Billions Current $) New Residential237.0141.2136.2128.6132.4142.1 -33.1%-40.4%-3.5%-5.6%2.9%7.3% Residential Improvements* 120.7112.7112.5112.8110.3115.2 -13.5%-6.6%-0.2%0.3%-2.2%4.5% Housing starts in thousands. *Residential Improvements include remodeling, renovation and replacement work. Number also includes RCD estimate of improvements to public housing. Source: Census Bureau, U.S. Department of Commerce. Forecast: Reed Construction Data.

49
Non-Residential Sector RCD reports non-residential construction spending has slipped for the last three months, following four months of increases RCD reports non-residential construction spending has slipped for the last three months, following four months of increases Activity in the near term will be limited Activity in the near term will be limited Current projections Current projections Decline of 4.5% in 2011 Decline of 4.5% in 2011 5.1% growth in 2012 5.1% growth in 2012 8.3% growth in 2013 8.3% growth in 2013 Source: Reed Construction Data

50
U.S. Non-residential Construction (millions of U.S. current dollars) ActualForecast 200820092010201120122013 437,744375,742288,921275,976289,977313,992 8.4%-14.2%-23.1%-4.5%5.1%8.3% Source: Reed Construction Data
 ActualForecast ,744375,742288,921275,976289,977313, %-14.2%-23.1%-4.5%5.1%8.3% Source: Reed Construction Data.")
51
The Dreaded Recession Scenario Issued in early September 2011 Issued in early September 2011 Year-over-Year % Change 2010201120122013 Baseline Forecast 3.0%1.6% 2.4% Recession Forecast 3.0%1.2%-1.6%2.0% Source: Reed Construction Data

52
A View From FMI Corp.

53
As a Whole FMI expects total construction put-in- place to be up 2% this year and 6% in 2012 FMI expects total construction put-in- place to be up 2% this year and 6% in 2012 But if you take inflation out of these numbers, then they’re looking at a 1% drop this year and a 3% increase in 2012 But if you take inflation out of these numbers, then they’re looking at a 1% drop this year and a 3% increase in 2012 Source: FMI Corp.

54
Lodging Lodging construction will drop 16% to $10 billion this year and show some signs of growth with a 4% rise in 2012 Lodging construction will drop 16% to $10 billion this year and show some signs of growth with a 4% rise in 2012 This sector has dropped around 55% from its highs in 2008 This sector has dropped around 55% from its highs in 2008 Green building is commonplace in remodels and retrofits Green building is commonplace in remodels and retrofits Source: FMI Corp.

55
Office Office construction will drop another 5% this year, on top of a 32% in 2010 Office construction will drop another 5% this year, on top of a 32% in 2010 Minor improvement expected in 2012 to get to $45.5 billion Minor improvement expected in 2012 to get to $45.5 billion Source: FMI Corp.

56
Commercial Commercial construction typically lags residential by 12 to 18 months Commercial construction typically lags residential by 12 to 18 months Won’t improve much in coming years Won’t improve much in coming years Bright spot is discount and food retailers who have major expansion plans Bright spot is discount and food retailers who have major expansion plans Source: FMI Corp.

57
Health Care Health care construction will grow a mere 2% this year, 3% in 2012 Health care construction will grow a mere 2% this year, 3% in 2012 However, despite slower growth rates, this sector remains at a historically high level However, despite slower growth rates, this sector remains at a historically high level Lots of facility renovation and modernization work taking place Lots of facility renovation and modernization work taking place Uncertainty over health care bill’s effect continues to delay expansion plans Uncertainty over health care bill’s effect continues to delay expansion plans Source: FMI Corp.

58
Education Construction put in place figure to drop 2% this year and rise 4% in 2012 Construction put in place figure to drop 2% this year and rise 4% in 2012 Renovation work to improve energy use will continue to drive work in this sector Renovation work to improve energy use will continue to drive work in this sector Seeing an increased use of prefab/modular construction techniques being used in this sector Seeing an increased use of prefab/modular construction techniques being used in this sector Source: FMI Corp.

59
Public Safety Public safety construction lost 8% in 2010 and another 4% this year Public safety construction lost 8% in 2010 and another 4% this year Forecasted to drop another 3% in 2012 Forecasted to drop another 3% in 2012 However, it’s not as bad as it sounds However, it’s not as bad as it sounds The current levels are well above those realized during the 2000-2006 timeframe The current levels are well above those realized during the 2000-2006 timeframe Source: FMI Corp.

60
Manufacturing Peaked in 2009, but dropped 33% in 2010 and is expected to drop another 6% this year Peaked in 2009, but dropped 33% in 2010 and is expected to drop another 6% this year Project another 2% drop in 2012 Project another 2% drop in 2012 Growth not expected to return until 2013 Growth not expected to return until 2013 This sector has lost more than 5 million jobs in the last decade This sector has lost more than 5 million jobs in the last decade Source: FMI Corp.

61
Power Power construction has benefited from wind and solar growth, as well as the need for grid modernization Power construction has benefited from wind and solar growth, as well as the need for grid modernization Construction put in place this year should be $89.7 billion or 7% over 2010 Construction put in place this year should be $89.7 billion or 7% over 2010 5% growth expected in 2012 5% growth expected in 2012 Steady growth expected in this sector for many years Steady growth expected in this sector for many years Source: FMI Corp.

62
Water Supply / Sewage and Waste Disposal Expected to fall 2% this year, but rise steadily through 2015 Expected to fall 2% this year, but rise steadily through 2015 Source: FMI Corp.

63
A View From McGraw-Hill Construction

64
As a Whole McGraw-Hill Construction (MHC) is forecasting no growth for construction starts next year, following a 4% drop this year McGraw-Hill Construction (MHC) is forecasting no growth for construction starts next year, following a 4% drop this year MHC’s chief economist notes, “Given the economy’s current fragile condition, an overall recovery may not come until 2013 or 2014.” MHC’s chief economist notes, “Given the economy’s current fragile condition, an overall recovery may not come until 2013 or 2014.” Source: McGraw-Hill Construction
 is forecasting no growth for construction starts next year, following a 4% drop this year McGraw-Hill Construction (MHC) is forecasting no growth for construction starts next year, following a 4% drop this year MHC’s chief economist notes, Given the economy’s current fragile condition, an overall recovery may not come until 2013 or MHC’s chief economist notes, Given the economy’s current fragile condition, an overall recovery may not come until 2013 or Source: McGraw-Hill Construction")
65
Stores Construction peaked in 2007, then fell 75% over next four years Construction peaked in 2007, then fell 75% over next four years Project no growth this year and a mere 2% rise in new square footage in 2012 Project no growth this year and a mere 2% rise in new square footage in 2012 Extreme discount chains lead the charge in this group Extreme discount chains lead the charge in this group Source: McGraw-Hill Construction

66
Warehouses Sector fell sharply in 2008-2010 timeframe, but now seeing some upward movement Sector fell sharply in 2008-2010 timeframe, but now seeing some upward movement 18% rise in square footage total in 2011 18% rise in square footage total in 2011 Project another 17% rise in 2012 Project another 17% rise in 2012 Increased trade should lift demand for additional space Increased trade should lift demand for additional space Source: McGraw-Hill Construction

67
Hotels Steep declines last two years, but projecting a 34% increase in square footage this year and another 17% rise in 2012 Steep declines last two years, but projecting a 34% increase in square footage this year and another 17% rise in 2012 Business travel has been strong and industry financials have strengthened Business travel has been strong and industry financials have strengthened Source: McGraw-Hill Construction

68
Offices After a steep decline that started in 2007, market is beginning to flatten out After a steep decline that started in 2007, market is beginning to flatten out 2% drop in new square footage this year 2% drop in new square footage this year 4% increase in 2012 4% increase in 2012 Recent activity has taken place in the government building, data center, and corporate building areas Recent activity has taken place in the government building, data center, and corporate building areas Source: McGraw-Hill Construction

69
Education School construction continues to decline School construction continues to decline 14% decline in new square footage projected this year on top of double-digit declines prior two years 14% decline in new square footage projected this year on top of double-digit declines prior two years Looking at a 9% drop in 2012 Looking at a 9% drop in 2012 2012 figure is comparable to levels realized back in the late 80s 2012 figure is comparable to levels realized back in the late 80s Source: McGraw-Hill Construction

70
Healthcare Facilities After falling by nearly 40% in 2009, sector rebounded by 6% in 2010 and is expected to hold steady this year and next After falling by nearly 40% in 2009, sector rebounded by 6% in 2010 and is expected to hold steady this year and next Still a need to replace aging facilities and meet the needs of a growing elderly population Still a need to replace aging facilities and meet the needs of a growing elderly population Source: McGraw-Hill Construction

71
Public Buildings A reduction in federal spending and the end of the stimulus package will hit this sector hard A reduction in federal spending and the end of the stimulus package will hit this sector hard Look for a 27% drop in square footage this year and another 9% drop in 2012 Look for a 27% drop in square footage this year and another 9% drop in 2012 Source: McGraw-Hill Construction

72
The Dreaded Recession Scenario Baseline ForecastRecession Forecast 2011201220112012 Total Construction-4%0-5%-7% Commercial Buildings+6%+8%+5%-6% Institutional Buildings-15%-2%-15%-3% Manufacturing Buildings+35%+4%+30%-5% Single-Family Housing-5%+10%-6%-2% Multi-Family Housing+13%+18%+12%-5% Public Works-16%-5%-17%-7% Electric Utilities+48%-24%+45%-35% Source: McGraw-Hill Construction

73
A Couple of Markets to Keep an Eye On

74
Power Transmission Line construction business in the early stages of a 10 to 20 year boom Line construction business in the early stages of a 10 to 20 year boom Investment will likely range from $12 billion to $16 billion annually through 2030* Investment will likely range from $12 billion to $16 billion annually through 2030* Two real drivers: Two real drivers: The need to deliver large amounts of renewable sources to population centers The need to deliver large amounts of renewable sources to population centers Increase the reliability of the grid Increase the reliability of the grid *Source: Brattle Group

75
Green Projects Cash-strapped manufacturers are looking for energy savings projects Cash-strapped manufacturers are looking for energy savings projects Commercial buildings benefit from upgraded lighting and HVAC systems Commercial buildings benefit from upgraded lighting and HVAC systems Public and educational buildings leading the charge Public and educational buildings leading the charge Utility rebates/incentives help sell these projects Utility rebates/incentives help sell these projects

76
And Finally, A Few Regional Predictions

77
Industrial Trends Report - Philadelphia Market still up on year, but demand stalls Market still up on year, but demand stalls Speculative construction remains nearly non- existent Speculative construction remains nearly non- existent Manufacturing losses should slow in coming quarters Manufacturing losses should slow in coming quarters Rents should hold steady Rents should hold steady Stable consumer spending should translate into more warehouse/distribution demand over the next few months Stable consumer spending should translate into more warehouse/distribution demand over the next few months Source: Grubb & Ellis

78
Office Trends Report - Philadelphia Little to no growth the norm Little to no growth the norm Look for more of the same in the coming quarters as the regional labor market struggles to rebound Look for more of the same in the coming quarters as the regional labor market struggles to rebound Consolidations and downsizings in the pharmaceutical sector will continue to drag on the market’s prospects for real growth Consolidations and downsizings in the pharmaceutical sector will continue to drag on the market’s prospects for real growth Source: Grubb & Ellis

79
Electrical Distributor Industry Sales – Philadelphia MSA HistoryForecast $ Million201020112012 Total$1,181,700$1,244,157$1,232,044 (% change)4.6%5.3%-1.0% Contractor$430,979$437,466$417,032 (% change)1.7%1.5%-4.7% Source: DISC
4.6%5.3%-1.0% Contractor$430,979$437,466$417,032 (% change)1.7%1.5%-4.7% Source: DISC")
80
Electrical Distributor Industry Sales – Regional Forecast (+4%) Data center construction is strong in this region Data center construction is strong in this region Airport expansion projects at JFK and in Philadelphia Airport expansion projects at JFK and in Philadelphia Philly (14%) and New York (9.6%) sport two of the lower downtown vacancy rates in the nation, according to Grubb & Ellis’ 2Q 2011 data Philly (14%) and New York (9.6%) sport two of the lower downtown vacancy rates in the nation, according to Grubb & Ellis’ 2Q 2011 data 201020112012 Middle Atlantic$10,767.7$11,607.7$12,070.7 New Jersey$4,076.1$4,394.0$4,569.3 New York$4,398.9$4,742.1$4,931.2 Pennsylvania$3,196.6$3,446.0$3,583.4 Source: Electrical Wholesaling
 Data center construction is strong in this region Data center construction is strong in this region Airport expansion projects at JFK and in Philadelphia Airport expansion projects at JFK and in Philadelphia Philly (14%) and New York (9.6%) sport two of the lower downtown vacancy rates in the nation, according to Grubb & Ellis’ 2Q 2011 data Philly (14%) and New York (9.6%) sport two of the lower downtown vacancy rates in the nation, according to Grubb & Ellis’ 2Q 2011 data Middle Atlantic$10,767.7$11,607.7$12,070.7 New Jersey$4,076.1$4,394.0$4,569.3 New York$4,398.9$4,742.1$4,931.2 Pennsylvania$3,196.6$3,446.0$3,583.4 Source: Electrical Wholesaling")
81
Thank you for this wonderful opportunity Questions?

Similar presentations

 National Commercial Bank (NCB)>")
 Authority.>")


 Robert Carrillo September2013.>")


