Download presentation
Presentation is loading. Please wait.

1
America’s Water Upmanu Lall water.columbia.edu

6
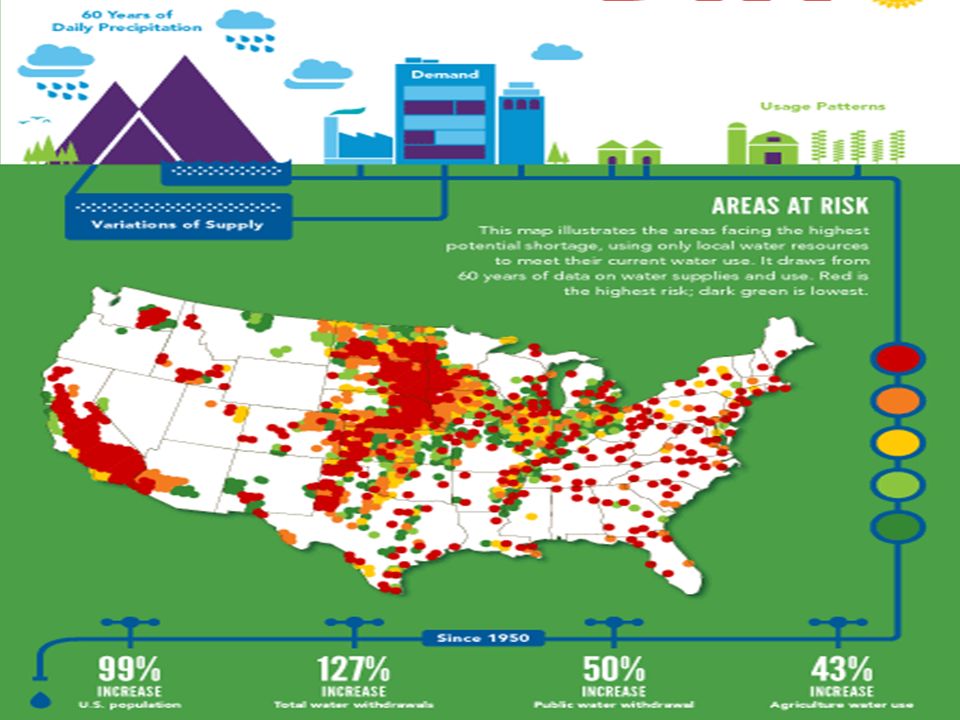
Trends over the last 60 years Projections for the next 60 still lack precision

7
US EPA Mapping of climate change impacts on water

9
America’s Water Initiative Some of the research questions to Prepare us for Global Leadership on Water for the 21 st century

10
Cities: Given the emerging trends on urbanization, energy, climate change, and water availability, what should be the model for urban water infrastructure for the 21 st century? Can storm and wastewaters be a renewable water resource, rather than a disposal problem ? How can municipal utilities anticipate water conservation strategies that emerge as water rates increased and map these projections into design and capacity expansion? What are the public or private financing models that can also stimulate economic and regional development? What are the potential economic impacts and risks to a city’s growth of a failing or well functioning water system?

11
National: What are the key elements of a national water policy and investment framework that addresses issues central to sustainable development of resources, and collective action? At the national scale, how can the location, design and composition of water and energy (including biofuel, thermal and renewable) systems be optimized, recognizing the nature of climate variability and regional resource endowments? How can economic uses of water be better allocated to promote higher efficiency and equity of use through short and long term trading of rights while protecting the resource? Can public-private partnerships be incentivized to close the water funding gap and bring the best global practices to the U.S.? How can agricultural and industrial water use and pollution be better managed, without impacting productivity? How can aggregate water use and pollution of large groundwater aquifers be assessed, predicted and managed to reflect their long term value as buffers to drought through appropriate pricing, incentives and regulation?
 systems be optimized, recognizing the nature of climate variability and regional resource endowments. How can economic uses of water be better allocated to promote higher efficiency and equity of use through short and long term trading of rights while protecting the resource. Can public-private partnerships be incentivized to close the water funding gap and bring the best global practices to the U.S.. How can agricultural and industrial water use and pollution be better managed, without impacting productivity. How can aggregate water use and pollution of large groundwater aquifers be assessed, predicted and managed to reflect their long term value as buffers to drought through appropriate pricing, incentives and regulation .")
12
Technology: What are the emerging technologies that could transform water and wastewater treatment and facilitate a new model for infrastructure development? How can they be stimulated? How can an industry framework be established to assess and adopt new technologies? Can the adoption of efficient, cutting-edge equipment and technologies be promoted by opening up conservative utility bidding procedures and by updating building codes? What is the role of data and analytical technologies in helping identify better system designs and management that are responsive to user needs and reduce costs?

13
Climate: What is a strategy for systematically addressing the major emerging climate risks at the urban and at the national scales? How can monitoring and forecast systems be used to better manage risks related to drought, floods, water quality, demand and supply to reduce climate related risks? How can the increasing risk of flood exposure and water quality degradation in coastal areas be better managed through strategic land use planning and infrastructure development? What are the additional costs and economic impacts of climate risk reduction strategies for water systems? How can regional water compacts (e.g., on the Colorado and Delaware Rivers) be better informed of potential climate shocks and the ability to manage them through better operation of the storage infrastructure and demands, including transfers across users and states?
 be better informed of potential climate shocks and the ability to manage them through better operation of the storage infrastructure and demands, including transfers across users and states .")
14
America’s Water: An exploratory analysis of Municipal Water Survey Data Rate of increase of Debt across the group approximately 2x of rate of increase in rates

15
Residential Rates per 1500 cf vs. Operating Expenses per 1500cf. The line of best fit (solid), the 95% prediction interval (dotted), and the 1:1 line (red) are shown.
, the 95% prediction interval (dotted), and the 1:1 line (red) are shown..")
16
Utility Level Cost Drivers Direct Rate Drivers Utility Size Climate & Geography Water Source Rates Operating Expenses Debt Population Cost Recovery Ratio Productivity Ratio Supply & Demand Drivers Figure 15: Conceptual Causal Network

Similar presentations


 in Southeast and Northeast Asia 19 August 2014, Bangkok,>")


 GEOSS S+T Stakeholder Workshop.>")


Familiarize State agency staff with Water Plan Update 2013 information, tools and resources 2)Identify opportunities for State agencies to derive.>")


