Download presentation
Presentation is loading. Please wait.

1
2003-2004 NRS Perspectives from the New York City ACS-NRS Research Project Presented by Dennis Deloria at the 2005 NHSA Conference Orlando, FL May 26, 2005 Email: ddeloria@verizon.net

2
Disclaimers Mr. Deloria has no connection with ACF or the NRS contractors. All NRS information presented here was obtained from publicly available sources or from original analyses within the NYC-ACS study. Mr. Deloria works for Mobius Corporation which developed Outcomes Express. He did not participate in the actual development of Outcomes Express. Mr. Deloria at one time worked for the High/Scope Foundation which developed the COR. The COR was developed after he left the organization.

3
NYC-ACS serves over 19,000 Head Start children In the 2003-2004 Program Year the New York City Administration for Children’s Services (ACS) served over 19,000 Head Start Children through 73 delegate agencies. English is the primary language of about 46% of the ACS children served, and Spanish is primary for about 38%. Other languages from everywhere in the world are spoken by the remaining 16% of the children. In some centers over 90% of the children speak Chinese, in others over 90% speak Hebrew. Nearly 100 other languages are spoken by ACS-HS children.

4
Three study questions This research project was initiated to explore three questions: First, what are the specific characteristics of the NRS Tests when used with the children served by ACS? Second, how do the NRS Tests relate to assessments already being carried out by ACS? Head Start children were already being assessed three times a year as required by the ACF Legislated mandates, and were also being assessed using curriculum-specific rating scales. Third, what are the characteristics of the NRS Tests when used with special subpopulations of children such as English language learners, and children with disabilities?

5
This presentation will focus first on the NRS test characteristics, secondly on the two other measures and on children

6
Four ACS Delegate Agencies Four NYC-ACS Delegate Agencies volunteered to participate in this study. These four agencies serve more than 1,000 three and four year old children each year. Only four year old children about to enter kindergarten are assessed as part of the NRS, so no three year old children are included in this study. NRS Data are available for 504 four year old children in the Fall, and 476 in the Spring. About 36% are English language learners.

7
Two existing ACS assessments are examined in this study Outcomes Express, a computer software system used by teachers to assess their children. This system was developed by Mobius Corporation specifically to help teachers meet the Federal ACF Outcomes Framework requirements. Half of the ACS Delegates use this as part of a pilot study. High/Scope Child Observation Record (COR ), a teacher rating scale designed to document children’s progress in the High/Scope Cognitively Oriented Curriculum. When this study began it was used by more ACS Delegates than any other curriculum oriented teacher rating scale.
, a teacher rating scale designed to document children’s progress in the High/Scope Cognitively Oriented Curriculum. When this study began it was used by more ACS Delegates than any other curriculum oriented teacher rating scale..")
8
How NRS forms were processed NRS forms were digitally scanned before being sent to the Federal contractors, providing exact pictures of both sides of the form. The digital images were converted to text files using Optical Character Reading software. The text files were then combined into a single database that included all children. The individual NRS items were scored and combined into English and Spanish subscores. Child NRS ID numbers were matched to child names using Delegate records. NRS data were matched to Outcomes Express and COR data using child names.

9
Let’s look at some NRS results

10
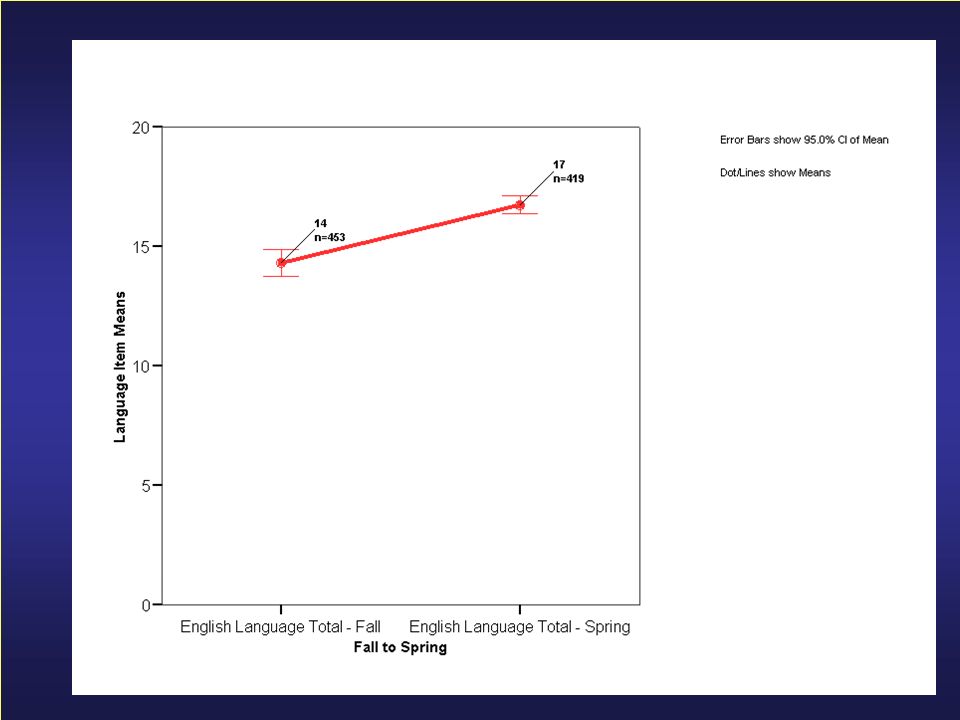
NRS Language Means Language mean scores increased from about 14 in Fall to about 17 in Spring. This gain is statistically significant but is only part of the story.

12
The NRS Language counts add important details The number of children failing the English Language Screen fell by nearly half, from 35% in Fall to 18% in Spring. This suggests that important positive results in teaching English were achieved by the teachers.

13
A histogram of Language scores reveals more information Many children achieved perfect or near-perfect scores. Some children got all or nearly all items wrong. Many more children achieved high than low scores because this is a assessment of English language ability, and there are many more English speaking than non- English speaking children. If we draw a “normal” curve over the distribution of scores it does not match. Normally distributed scores have special properties that help in statistical analyses.

15
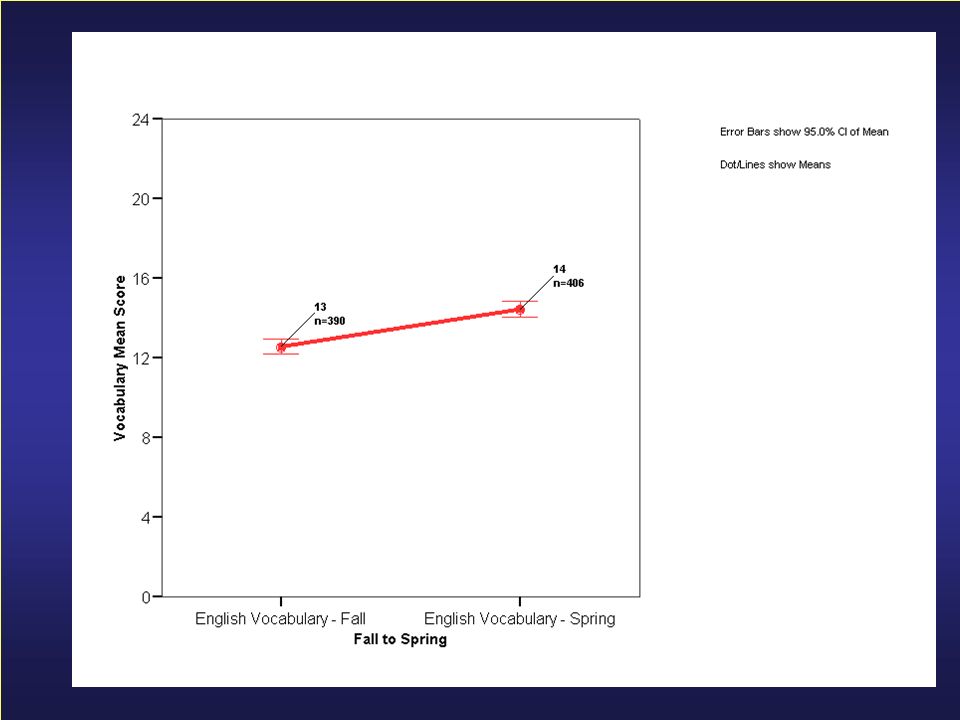
The NRS Vocabulary scores are quite different than the NRS Language scores, and present special difficulties in interpretation Vocabulary means increase from about 13 in Fall to 14 in Spring. Even though it is a statistically significant gain it has essentially no meaning in this raw form. This fact is not apparent from the means in the following line graph. On the surface the Vocabulary line graph looks similar to the Language line graph.

17
The Vocabulary histogram is quite different than the Language histogram. When we look at the Vocabulary histogram we see that most children are grouped tightly near the middle of the 24 items. Very few children achieved high scores. Very few children got low scores. The distribution of scores fits a normal curve almost perfectly.

19
Language and Vocabulary are designed for different purposes The Language items are designed to identify children belonging to two groups – English speakers and Spanish speakers. In a perfect world all children would get all items correct on both the English and Spanish versions – in other words all children would score 20, with no measured differences among children. In contrast the Vocabulary items are designed to measure skill level differences among children, with scores centered, normally distributed, and few or no children with zero scores or perfect scores. But the process used to maximize the spread of children forces us to give up any direct way of interpreting the raw scores. The raw Vocabulary scores have to undergo complex rescaling before they achieve any real world meaning. Only the designers know how to do this.

20
To understand the NRS Vocabulary scores we must know its background Items used came originally from the Peabody Picture Vocabulary Test, Third Edition (PPVT-III). “The PPVT-III is a test of listening comprehension for the spoken word in standard English.” (quote from manual) The 24 NRS Vocabulary items were selected across a child age range from about three years old to nine years old. This is completely different than the precise administration directions for the PPVT itself. This change means that none of the original PPVT norms or 40 years of research can be used with the NRS data.
 The 24 NRS Vocabulary items were selected across a child age range from about three years old to nine years old. This is completely different than the precise administration directions for the PPVT itself. This change means that none of the original PPVT norms or 40 years of research can be used with the NRS data..")
21
NRS Vocabulary Item Selection The 24 Fall Vocabulary items were selected from 84 PPVT-III (Version A) items between ages 2-6 years and 9 years. Twenty-four different items from the same 84 source items were used in Spring. The wide age range insures that few children will get very high scores, and few will get very low scores. Data on these exact items from previous Head Start studies gave the statistical information needed to select some particular items instead of others. This enabled the NRS developers to precisely set the overall test difficulty level near the middle of the items for both Fall and Spring. This method of item selection (Item Response Theory - IRT) has benefits and drawbacks. The benefits include enabling researchers to capture much more information, both about the children and about the test itself. The drawbacks include inability to directly interpret scores and inability to track child growth on individual items.
 has benefits and drawbacks. The benefits include enabling researchers to capture much more information, both about the children and about the test itself. The drawbacks include inability to directly interpret scores and inability to track child growth on individual items..")
22
It is difficult to explain Vocabulary gains Raw scores have no direct meaning. Different items were used in Fall and Spring, so it is not possible to measure item gains. The items were selected to place the highest number of scores in the exact middle of the 0 to 24 item spread, both Fall and Spring, which artificially removes any gains we might expect. It’s like marking a child’s height on the wall when standing on a 12” box in the Fall, and a 6” box in the Spring. We have to know the height of the box to make any sense of the mark on the wall.

23
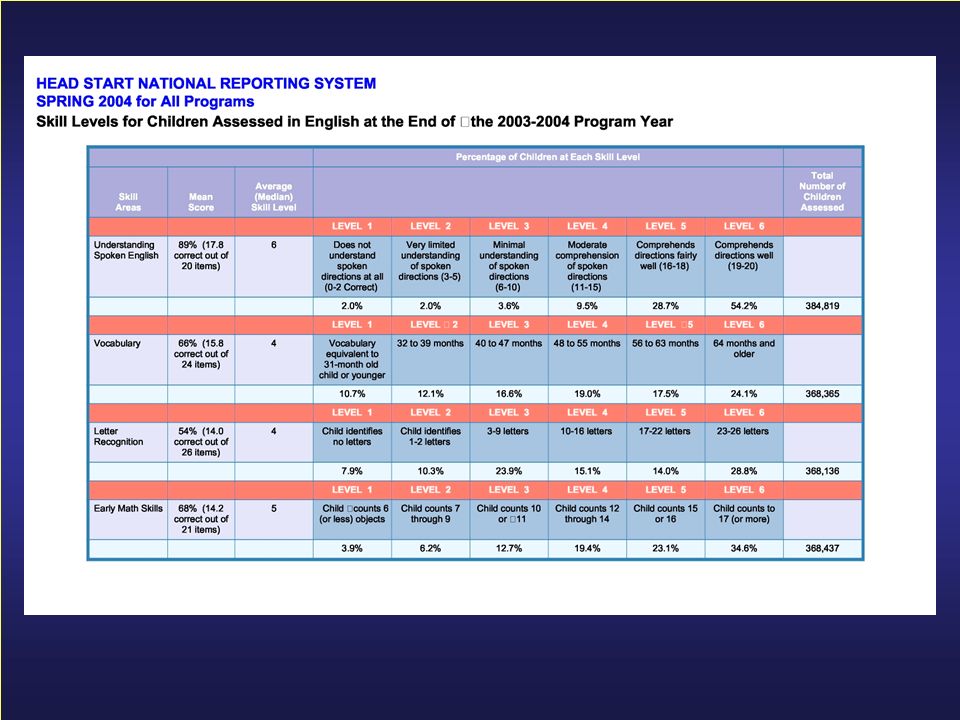
How did ACF present Vocabulary Gains? For both Fall 2003 and Spring 2004 the Vocabulary scores were presented in the identical format: six increasing skill levels, numbered 1 to 6, shown from left to right. But the labels assigned to each skill level changed: for example in Fall the skill level 6 means 54 months and older, but in Spring skill level 6 means 64 months and older. These shifts adjust for the size of the “box” each child stood on when NRS measured their “height”. In some cases only one single item right or wrong will move a child to a different skill level. The age level interpretations are unclear – who is the reference population? And what statistical steps support this interpretation?

26
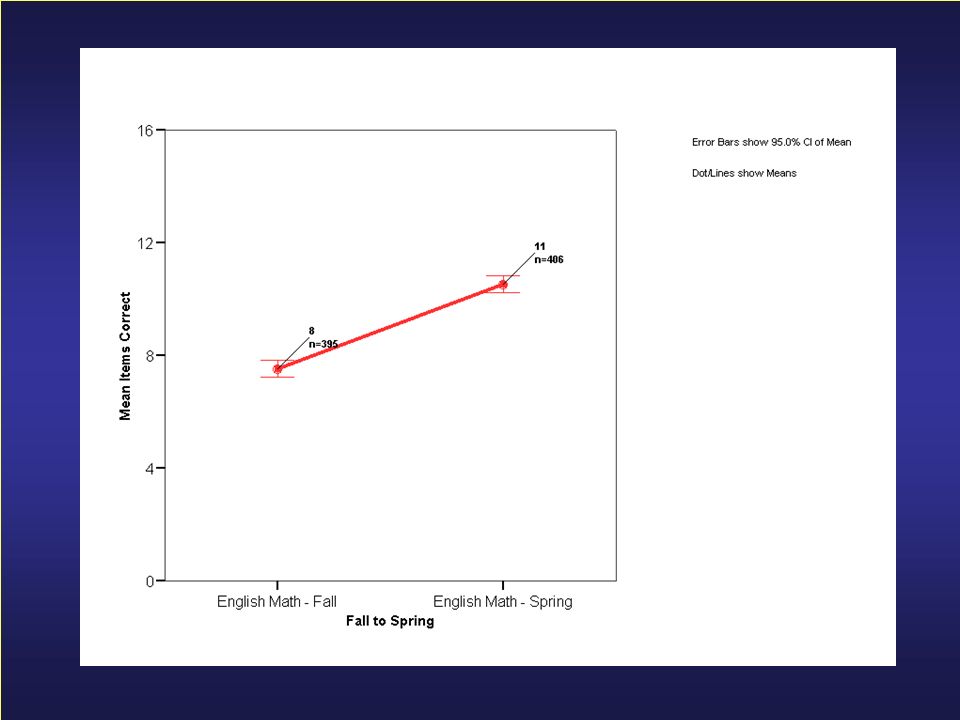
NRS Math shares same difficulties of interpretation The Math scores show a larger Fall-Spring gain than Vocabulary, but the same difficulties apply because a similar development process was used. The Math score histogram is similar to Vocabulary: good normal curve with no zero or perfect scores

29
There are no interpretation difficulties with NRS Letters Letter Recognition scores can be interpreted directly. In the Fall the average child knew 10 letters. In Spring the average child knew 16 letters.

31
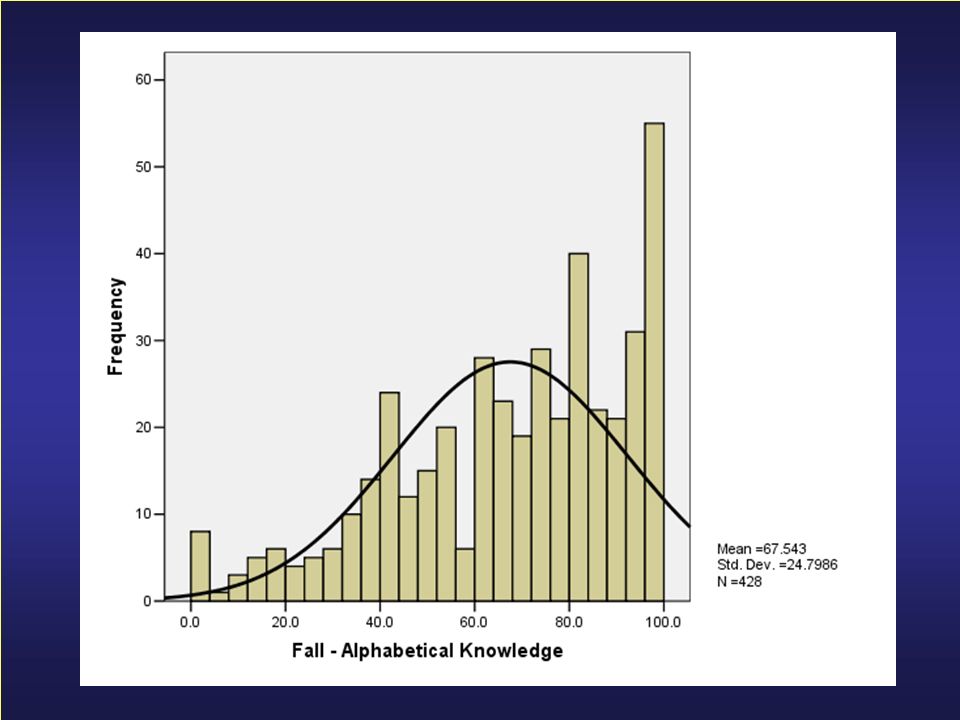
The Letter histogram is similar to the Language histogram, and different than the Vocabulary and Math ones Many children knew all the English letters. Many children knew none of the English letters. The distribution is non-normal.

33
Fall to Spring English Letters The direct nature of the English Letter Recognition task permits a meaningful Fall to Spring comparison.

35
Fall to Spring Spanish Letters We can do the same for Spanish Letters. For example we can see the percentages are lower, and some letters prove especially difficult for four year olds.

37
We have just seen two approaches to design: norm based versus criteria based Norm-Referenced measures like Vocabulary and Math are designed to identify as many differences among children of different abilities as possible. These NRS measures are clear examples of this approach. Criterion-Referenced measures like Language and Letters are designed to find out which children can succeed at a particular task, even when every child succeeds so that there are no measurable differences between children on that item.

38
With this background, let’s look at the two other ACS assessments in this study

39
Congress Enacted Criteria Based Requirements Congress wanted all children to pass the criteria specified in the legislation. Examples include: Child identifies at least 10 letters of the alphabet Child associates sounds with written words Child develops increasing ability to count in sequence to 10 and beyond Child uses an increasingly complex and varied spoken vocabulary For non-English-speaking children, child progresses in speaking English

40
Outcomes Express is Criteria Based Outcomes Express was developed to directly address the Domains, Domain Elements, and Indicators defined by ACF to meet Congressional requirements. It assesses over 40 indicators that can be used individually to measure gains, or combined into subscores to measure broader domain gains. Most Outcomes Express indicators measure actual child performance, like the NRS does. A few Outcomes Express indicators use teacher ratings of their children, like the COR does.

41
Outcomes Express Provides to teachers a standard way to implement and manage the assessment process for all the children in her classes. Presents a series of computer based activities to the child, directly recording the child’s actual performance. The activities are presented in either English or Spanish. Presents to the teacher a rating checklist for each child in order to assess child development beyond the scope of the computer activities (such as social/emotional development).
..")
42
How teachers use Outcomes Express Assessment is carried out with the child and teacher seated together at a computer. The computer can be in a classroom or elsewhere, desktop or laptop. Outcomes Express software presents spoken requests to the child, and the child replies by pointing to something on the display screen. The teacher uses the mouse to click on the exact place where the child points. The computer records all of the child’s responses as well as other details of the assessment. After the child finishes and returns to class the teacher can complete a rating scale on the display screen about that child. The teacher’s ratings are automatically recorded with the child’s responses.

43
Outcomes Express Subscores For this study the Outcomes Express indicators have been combined into five subscores: Colors, Shapes, and Spatial Awareness Alphabetic Knowledge Print Awareness Word Sound Awareness Math Skills Social-Emotional Skills

44
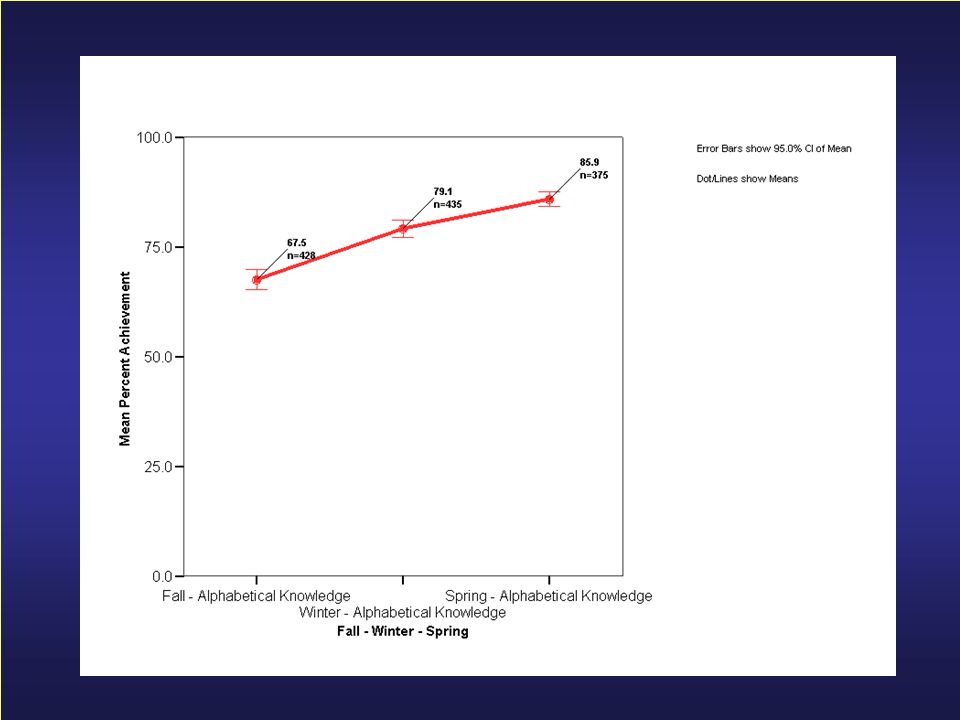
Alphabetic Knowledge results are comparable to NRS Letter Recognition results Like NRS Letters, children show large Fall to Spring gains. Like NRS Letters many children know all of the letters presented. Like NRS Letters a few children don’t know any letters. Outcomes Express randomly presents 10 letters to each child, NRS Letters presents all 26 letters to each child. There is a correlation of.72 between 10 letter Outcomes Express score and 26 letter NRS score

47
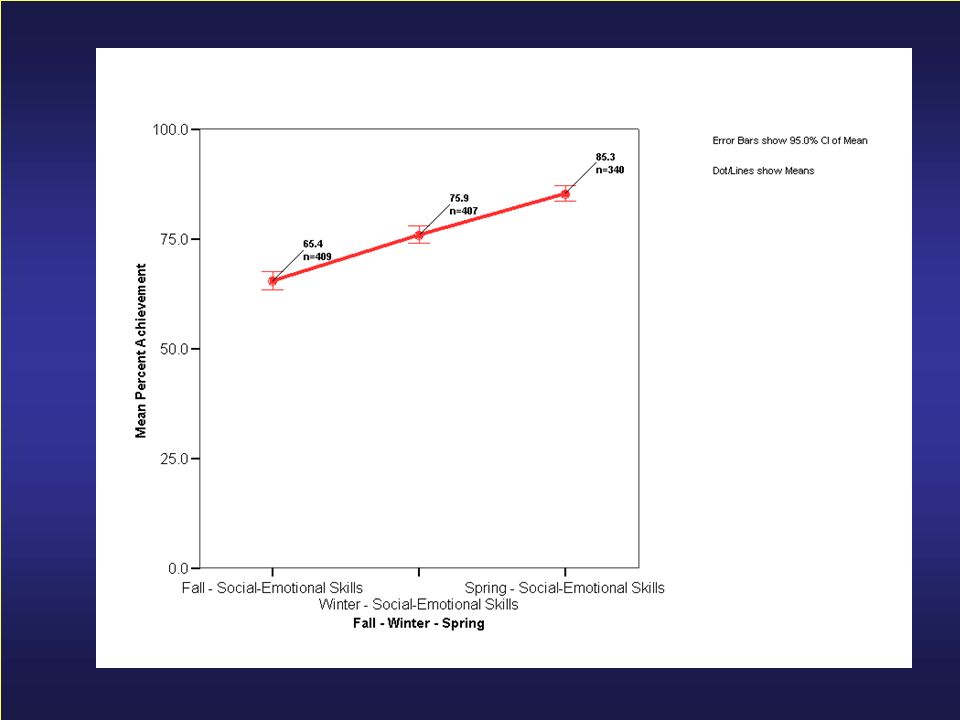
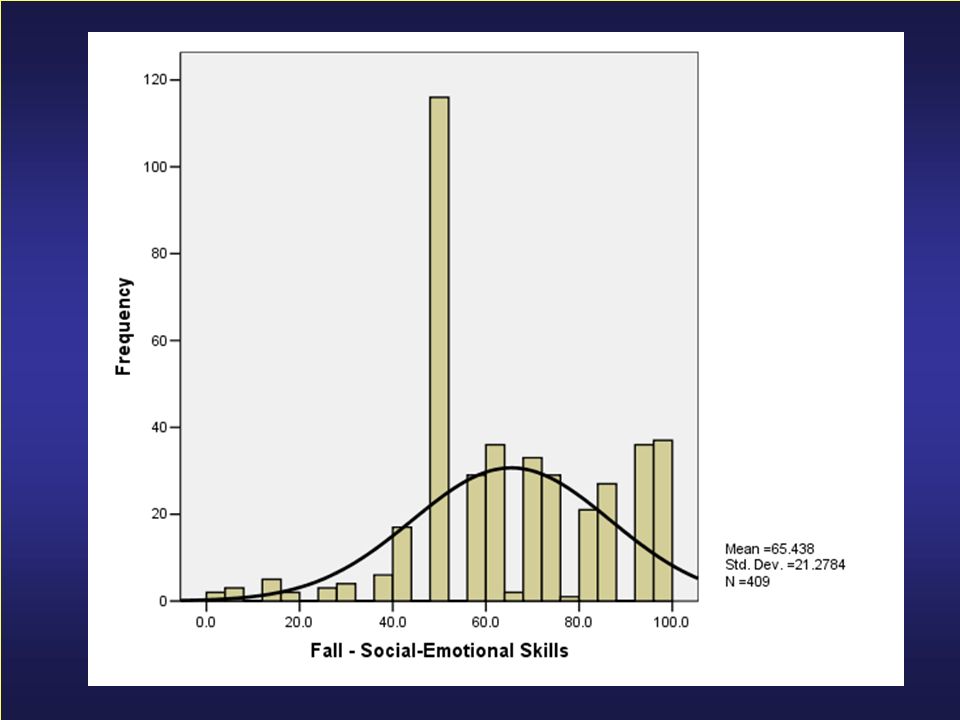
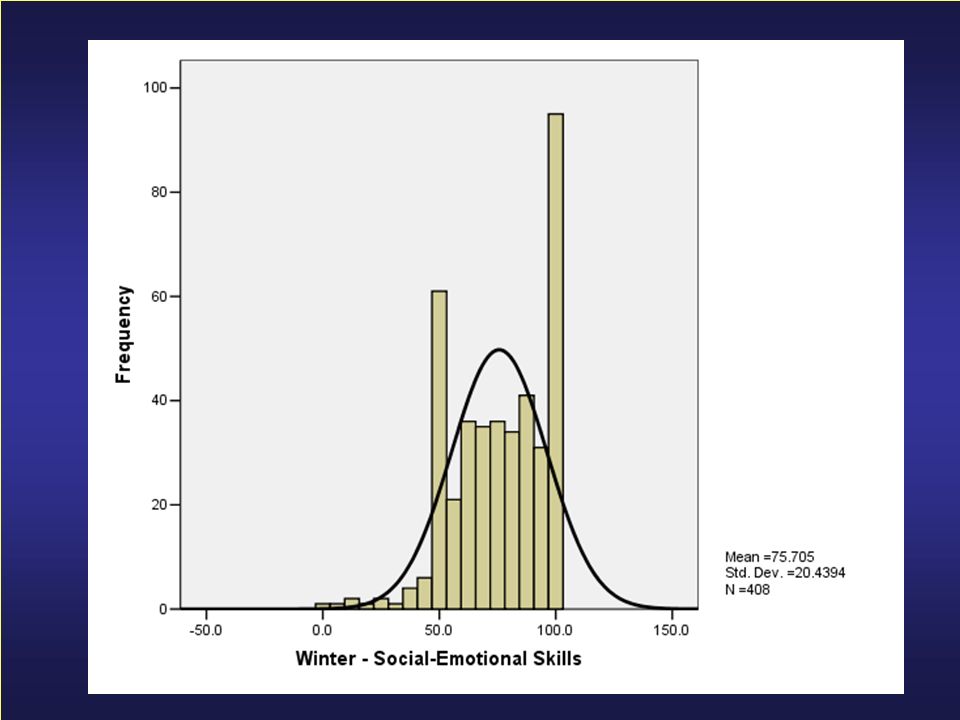
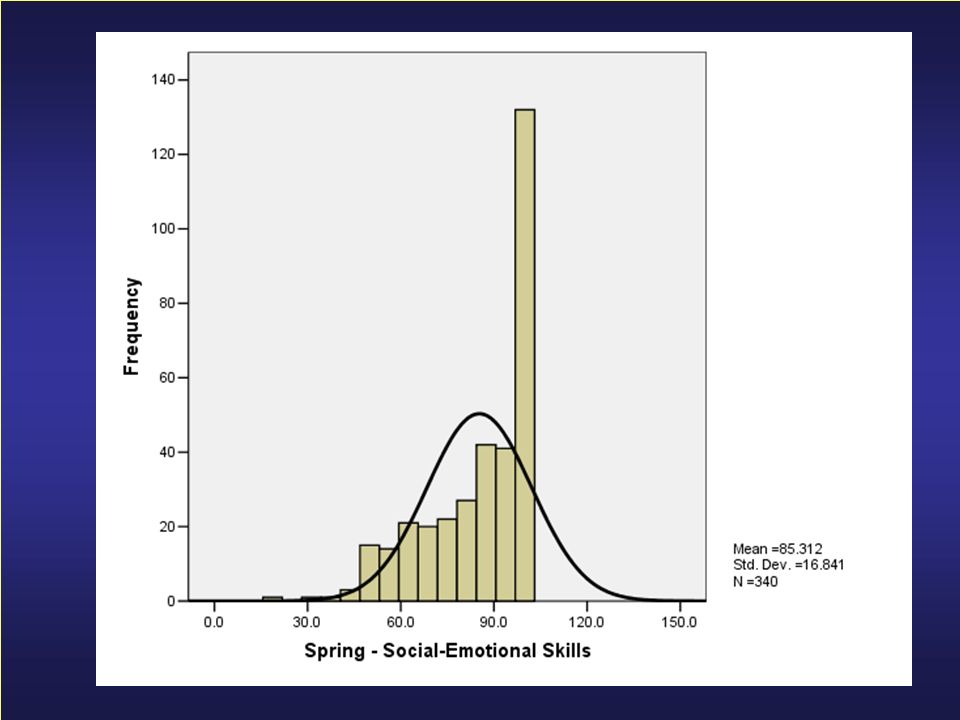
Outcomes Express Social/Emotional rating scores show a different pattern than either norm or criteria based items The means look similar, but the histograms are different. In the Fall there is a pronounced spike in the exact middle of the score distribution. This suggests that many teachers took the easy way and rated most of their children exactly the same. Perhaps this was because they had not yet spent enough time with their children to learn about their differences. Their ratings shifted and became more favorable in Winter, and even more so in Spring.

52
High/Scope Child Observation Record (COR) is curriculum based
 is curriculum based")
53
COR Domains Six categories are included in the COR: Initiative Social Relations Creative Representation Music and Movement Language and Literacy Logic and Mathematics

54
About the COR The COR subscore names remind us that child development involves much more than just the NRS areas of language, vocabulary, and math. The COR items are based on developmental concepts that are valued by the High/Scope Curriculum, not on test theories or Congressional mandates. Teachers rate their own children in an ongoing way based on ordinary classroom activities, rather than during a separate “test” situation. More importance is placed on improving teacher’s abilities to observe and respond to key behaviors in their children than on objectively assessing children. Because it is a teacher rating scale, not a child performance measure, the particular teacher who does the rating affects score levels more than the child’s own characteristics, such as age and skills.

55
Two of the COR subscores involve developmental areas parallel to NRS Language and Literacy, and Logic and Mathematics When we examine results for these subscores we see clear differences from both the NRS and Outcomes Express. Note: the child sample size is smaller than those for NRS and Outcomes Express because only one of the four delegates provided data (n approximately 180 children)
.")
56
COR Language and Literacy Two characteristics stand out here: First, the level of accuracy in Fall is lower as shown by the error bars, which are much farther apart than are any for the NRS or Outcomes Express. Accuracy increases in Winter and Spring. Second, the gains are much smaller from Fall to Winter and Spring. The gains are not statistically significant. Even if we increase the number of children in this sample to be the same as NRS and Outcomes Express such small gains are unlikely to become significant.

58
COR Logic and Mathematics Characteristics of this subscore is similar to the COR Language and Literacy, but even more pronounced: wide error margins and small Fall to Spring gains. The especially wide margins in Fall are due to the small number of children (37) who were rated by their teachers. This may reflect the difficulties teachers face when trying to rate complex skills like math when they have just met the children. This may be a typical problem with most rating scales. The number of children rated rises in Winter and Spring. The mean ratings stay nearly the same.
 who were rated by their teachers. This may reflect the difficulties teachers face when trying to rate complex skills like math when they have just met the children. This may be a typical problem with most rating scales. The number of children rated rises in Winter and Spring. The mean ratings stay nearly the same..")
60
What can we take from all this? What we choose to measure, and the methods we choose for the purpose, have a powerful effect on the results we get. All three of the assessment methods reviewed here have strengths, and all have weaknesses. When we examine assessment findings we have to be “educated consumers”, asking ourselves and others if the methods are appropriate and if the results make sense. The highest criteria is whether assessment findings are useful for helping us improve the developmental experiences we provide for our Head Start children. This is the issue we are all struggling with right now, and the jury is still out.

Similar presentations


267-1072>")


 Administered May 2012 Kentucky test aligned.>")

