Download presentation
Presentation is loading. Please wait.

1
Introduction to GREAT for ELs Office of Student Assessment Wisconsin Department of Public Instruction (608)267-1072 Osamail@dpi.wi.gov
")
2
What is GREAT? The Growth Excel Analysis Tool, or GREAT, is a means to observe a student’s English Language Proficiency measured growth over time. GREAT is an interactive Excel-based tool. This tool can be found at http://oea.dpi.wi.gov/oea_ells/#growthell http://oea.dpi.wi.gov/oea_ells/#growthell

3
This presentation will Provide an explanation of GREAT Define the terms and concepts used within GREAT Describe how to use GREAT Demonstrate how to use GREAT using hypothetical student data

4
GREAT’s Purpose To observe a student’s growth in language proficiency over time in relation to other students’ growth To explore a student’s progress within specific language domains To assist with program design and direction

5
Terms and Definitions Growth Percentile Norm Group Domain Composite Scale Score & Percentile Rank

6
Growth Percentile A Growth Percentile is a numerical classification of the percent of students making a given increase in scale score. For example, if a scale score increase of 50 points represents the 75 th growth percentile, this indicates that an increase of 50 points is more than the increase experienced by 75% of students. GREAT measures the 25 th, 40 th, 60 th and 75 th growth percentiles at each starting proficiency level. ◦ This will be explained in more detail in a few slides.

7
Norm Group The norm group is the group of students comprising the standardization sample for the test. This sample is composed of the English Language (EL) students who took the ACCESS for ELLs ® in either: ◦ The State of Wisconsin, OR; ◦ The World-class Instructional Design and Assessment (WIDA) Consortium States. The test data used by the norm group depends on the year and data available.
 students who took the ACCESS for ELLs ® in either: ◦ The State of Wisconsin, OR; ◦ The World-class Instructional Design and Assessment (WIDA) Consortium States. The test data used by the norm group depends on the year and data available..")
8
Domain Composite These are the combined weighted scores from ACCESS for ELLs for each of the four language domains: reading, writing, speaking and listening. The weighting reflects the differential contributions of each language domain required for academic success. Oral Language: Oral Language score is attributed to equally weighted scale scores from Listening (50%) and the other 50% to Speaking. Literacy: The Literacy composite score combines equally weighted scale scores from Reading (50%) and Writing (50%). Comprehension: The Comprehension composite score combines the scale scores for Listening (30%) and Reading (70%). Overall Scale Score: The Overall Scale Score reflects a weighted score based on the scales scores for Listening (15%), Speaking (15%), Reading (35%), and Writing (35%).
 and the other 50% to Speaking. Literacy: The Literacy composite score combines equally weighted scale scores from Reading (50%) and Writing (50%). Comprehension: The Comprehension composite score combines the scale scores for Listening (30%) and Reading (70%). Overall Scale Score: The Overall Scale Score reflects a weighted score based on the scales scores for Listening (15%), Speaking (15%), Reading (35%), and Writing (35%)..")
9
Scale Score & Percentile Rank Scale scores allow raw score across grades and tiers to be compared on a single vertical scale. A scale score allows for comparisons between tests from one year to the next. Raw scores represent the number of test items answered correctly. Scale scores are derived from Raw scores. Percentile rank is a number between 1 and 99 indicating the percent of students falling at or below that score.

10
What does the Data Tool allow you to do? This hypothetical student had average growth compared to all students in the WIDA consortium. GREAT allows educators to see the academic growth of their individual students.

11
What does the Data Tool allow you to do? Educators can analyze the growth of their students in four areas: Overall Composite Score growth, Comprehension growth, Literacy growth, and Oral Proficiency growth. Additionally, educators can compare their students’ growth to either all students in the State of Wisconsin, or all students in the WIDA Consortium.

12
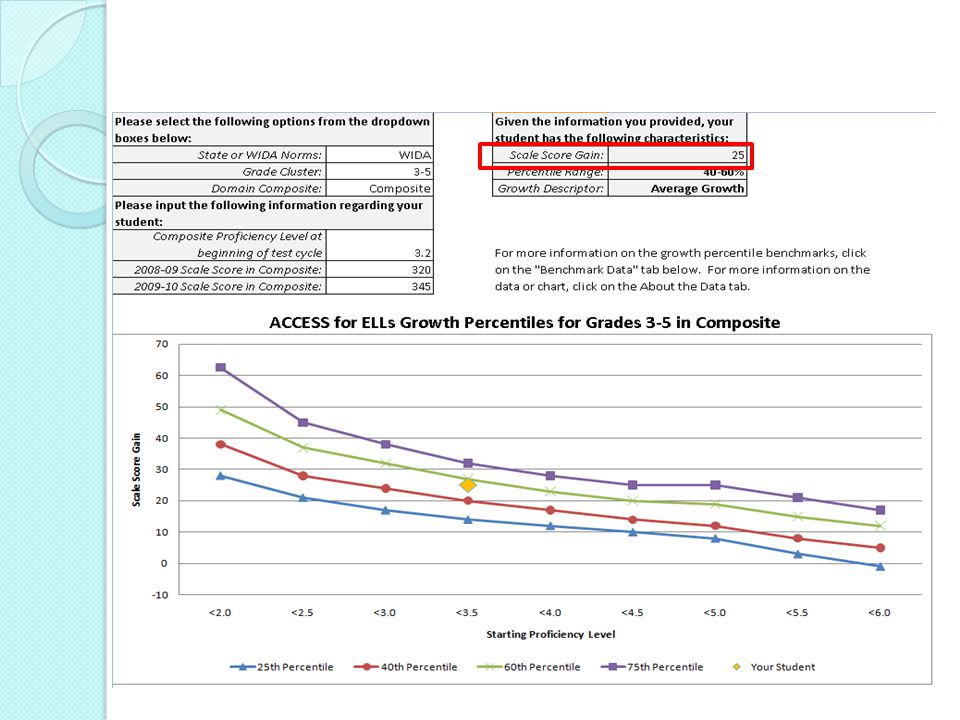
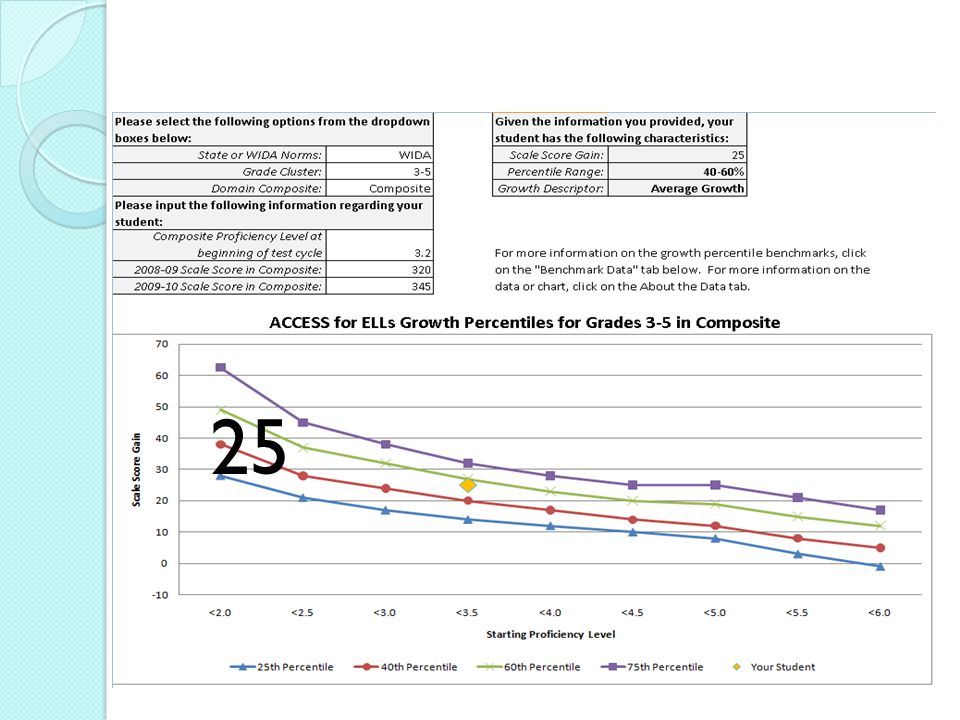
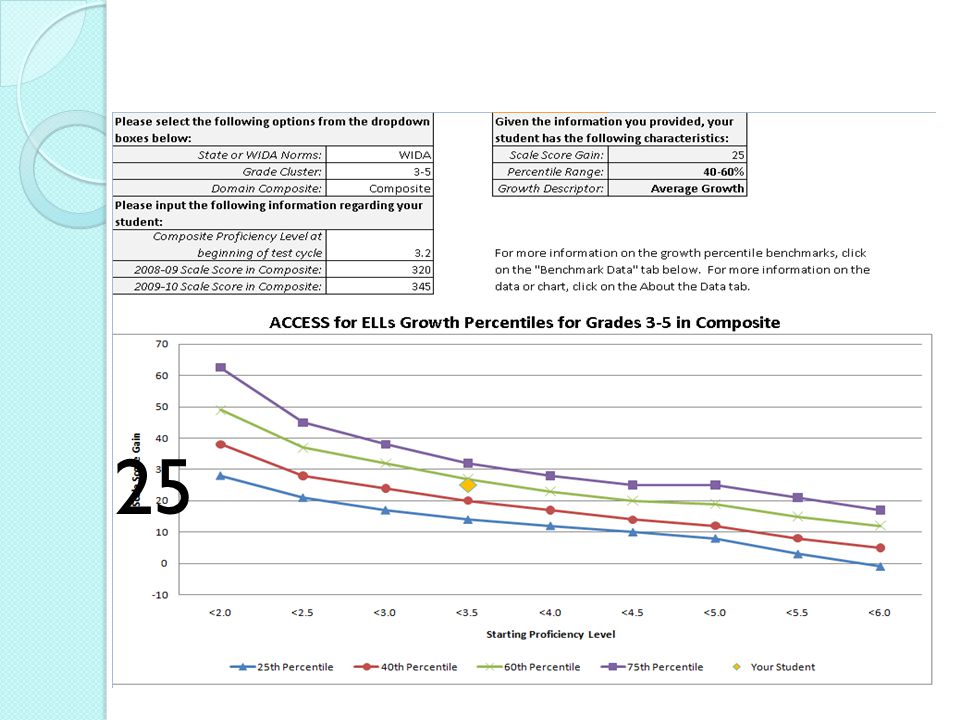
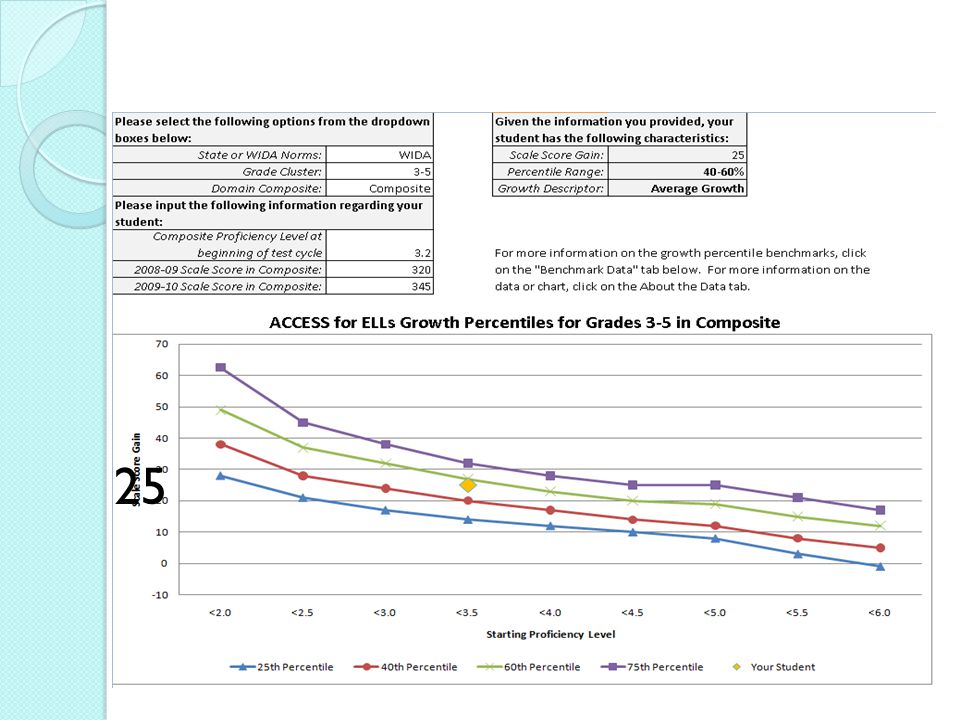
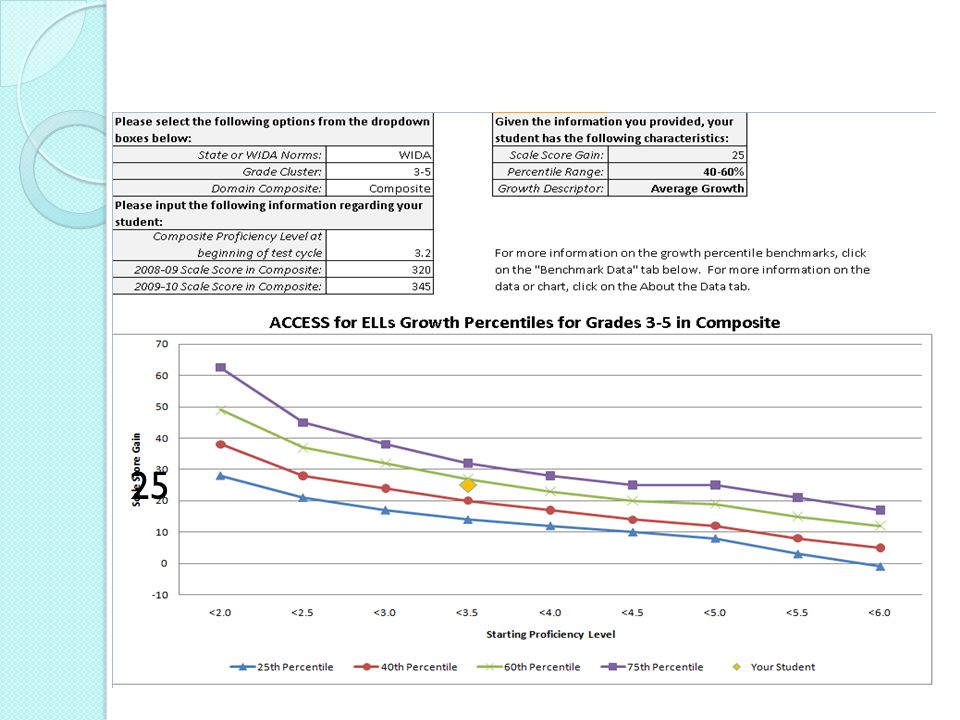
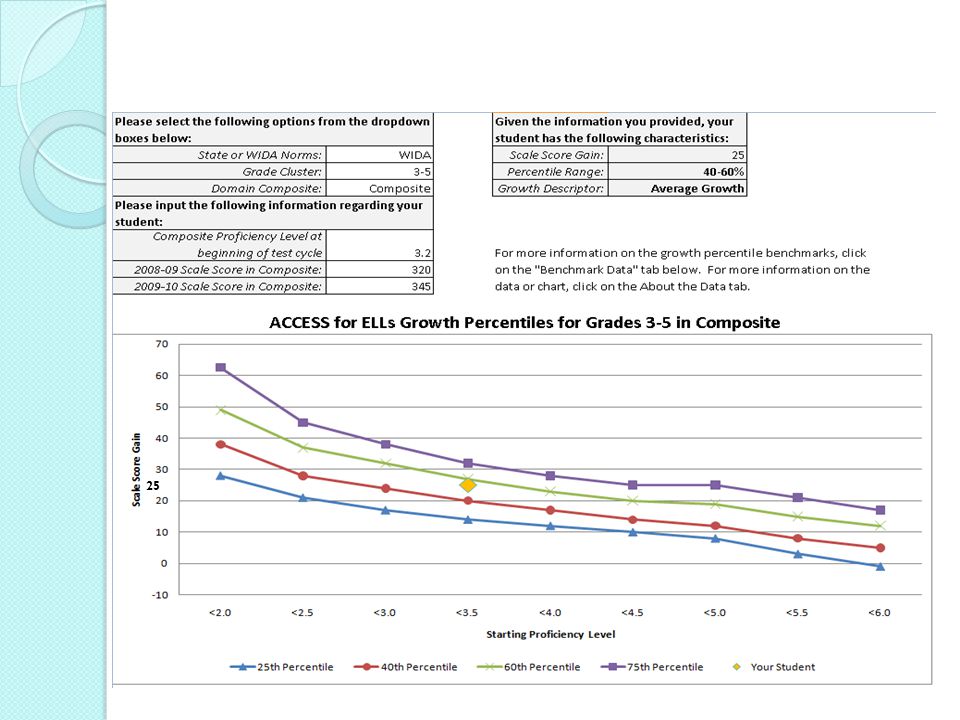
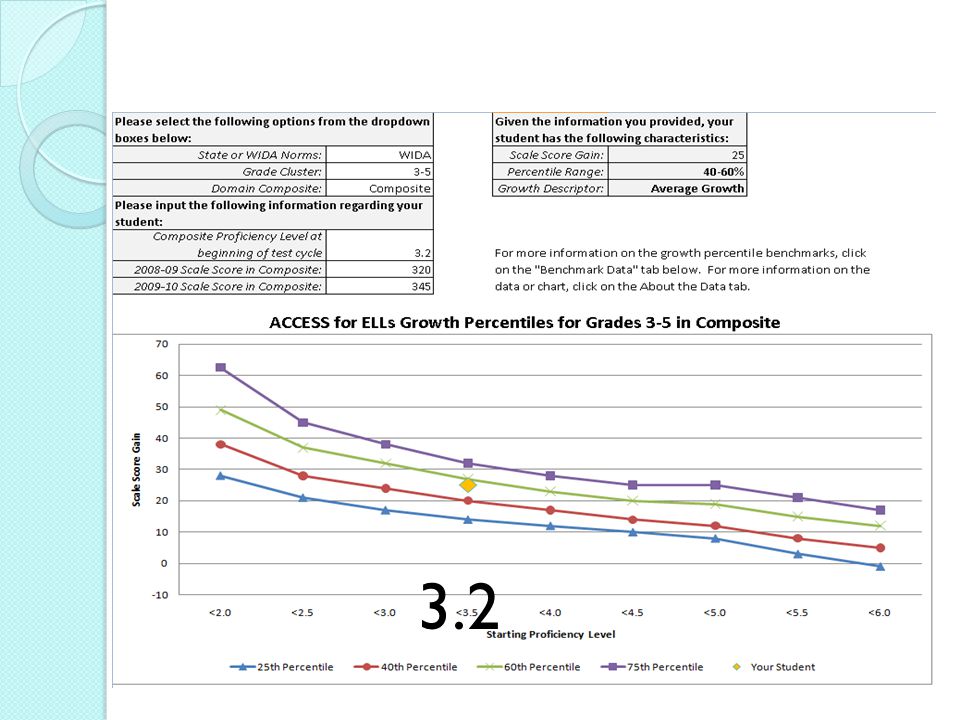
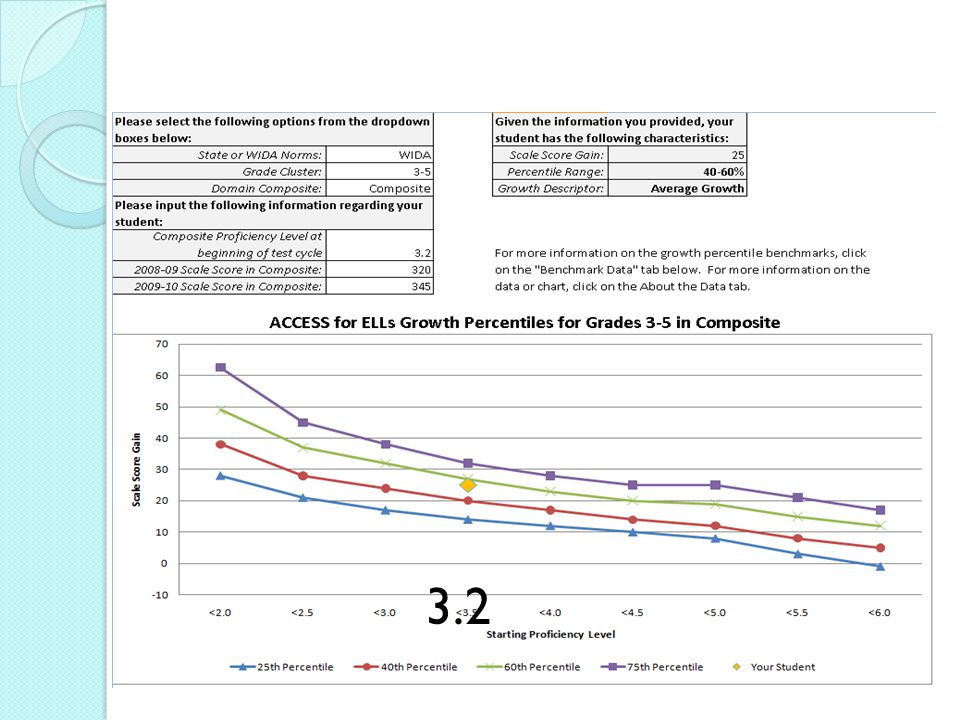
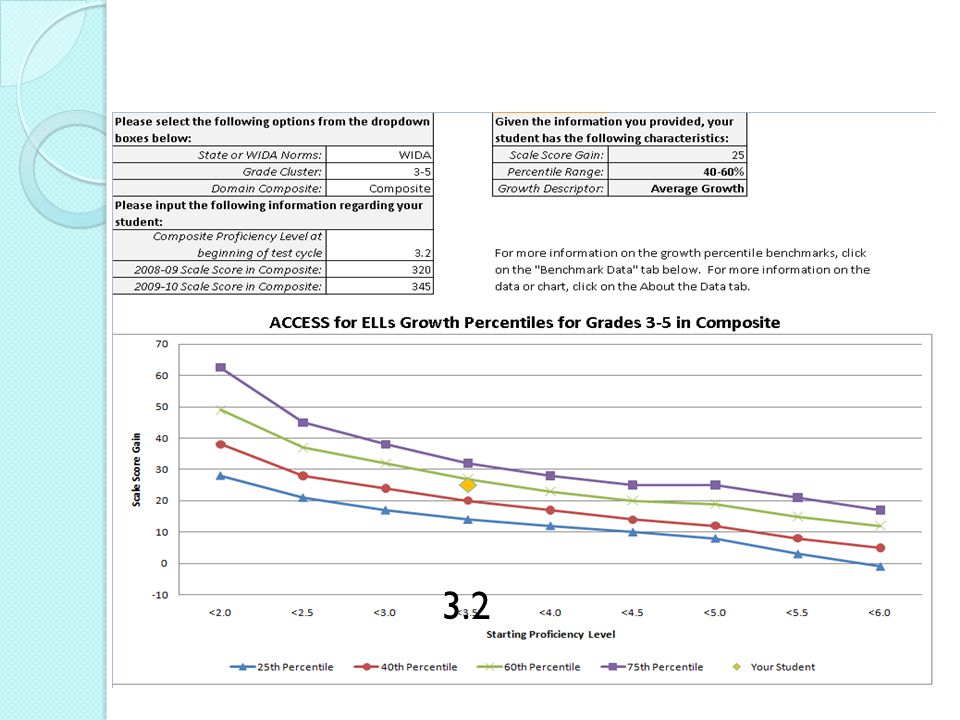
Basics of the Tool The y-axis shows the change in the student’s ACCESS Scale Score between the first and second years of the test cycle. Positive numbers indicate an increase in scale score, negative numbers indicate a decrease in scale score. The x-axis represents the student’s Composite Proficiency Level on the ACCESS for ELLs Assessment during the first year of the test cycle. The lines indicate the average scale score gains for students at different percentile ranks. The top (green) line represents students in the 75 th percentile. These students, on average, had the highest scale score gains between last year and this year when compared with students in the 60 th, 40 th and 25 th percentiles. A graphical representation of your student’s growth. Educators enter their students’ ACCESS for ELLs Assessment data here. This data is then compared with data from students throughout either the State of Wisconsin or the WIDA consortium to produce a graphical representation of the student’s English Language growth.
 line represents students in the 75 th percentile. These students, on average, had the highest scale score gains between last year and this year when compared with students in the 60 th, 40 th and 25 th percentiles. A graphical representation of your student’s growth. Educators enter their students’ ACCESS for ELLs Assessment data here. This data is then compared with data from students throughout either the State of Wisconsin or the WIDA consortium to produce a graphical representation of the student’s English Language growth..")
13
A demonstration on using GREAT

14
A Sample Student Profile A ESOL teacher, Ms. Webster, wants to see how her student Sam, an English Learner, is progressing in his acquisition of English. Sam has been at the school since kindergarten and is now in fourth grade. At home, Sam speaks Spanish. Sam doesn’t say much in school and makes every attempt to do what is asked in class. Sam has not yet scored proficient on the state content exam, but enjoys reading if there’s not too much.

15
School Records Ms. Webster reviews Sam’s school records and sees that Sam completed the ACCESS for ELLs Assessment in Fall 2008, when Sam was in 3 rd grade, and Fall 2009, when Sam was in 4 th grade. These were Sam’s ACCESS scores by domain. 2009 Proficiency Level Fall 2009 Scale Score (3 rd Grade) Fall 2010 Scale Score (4 th Grade) Overall Composite Score 3.2320345 Literacy Composite Score 3.0270305 Oral Composite Score 3.3340355 Comprehension Composite Score 3.3350365 *Note: The Reading, Writing, Listening and Speaking domains are not included in this table because they are not analyzed for growth.
 Fall 2010 Scale Score (4 th Grade) Overall Composite Score Literacy Composite Score Oral Composite Score Comprehension Composite Score *Note: The Reading, Writing, Listening and Speaking domains are not included in this table because they are not analyzed for growth..")
16
From these ACCESS data, Ms. Webster sees that Sam, although he has not seen a dramatic jump in his scale score, is making progress. But how does Sam’s progress compare to his peers? Ms. Webster decides to open up GREAT so that she can better understand Sam’s test scores and his progress in acquiring English Language proficiency.

17
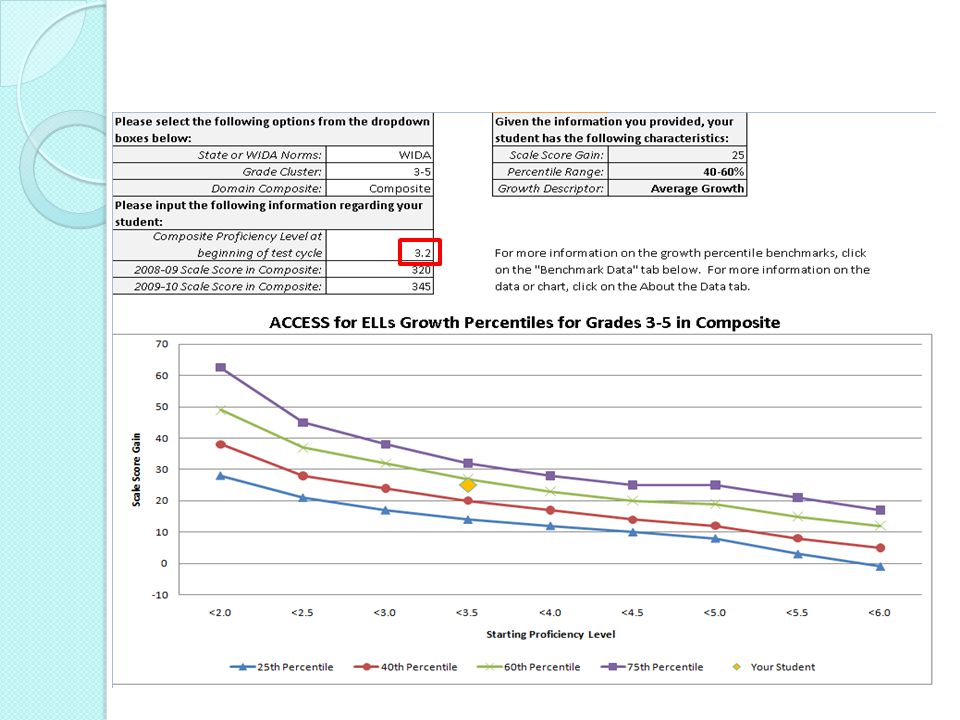
Step 1) Select the Norm Group, Grade Cluster, and Domain Ms. Webster wants to compare Sam’s progress to all WIDA Students. Sam was in 3 rd grade at the start of the test cycle, so Ms. W. selects the 3-5 grade cluster. She wants to see Sam’s Overall Composite Growth.

18
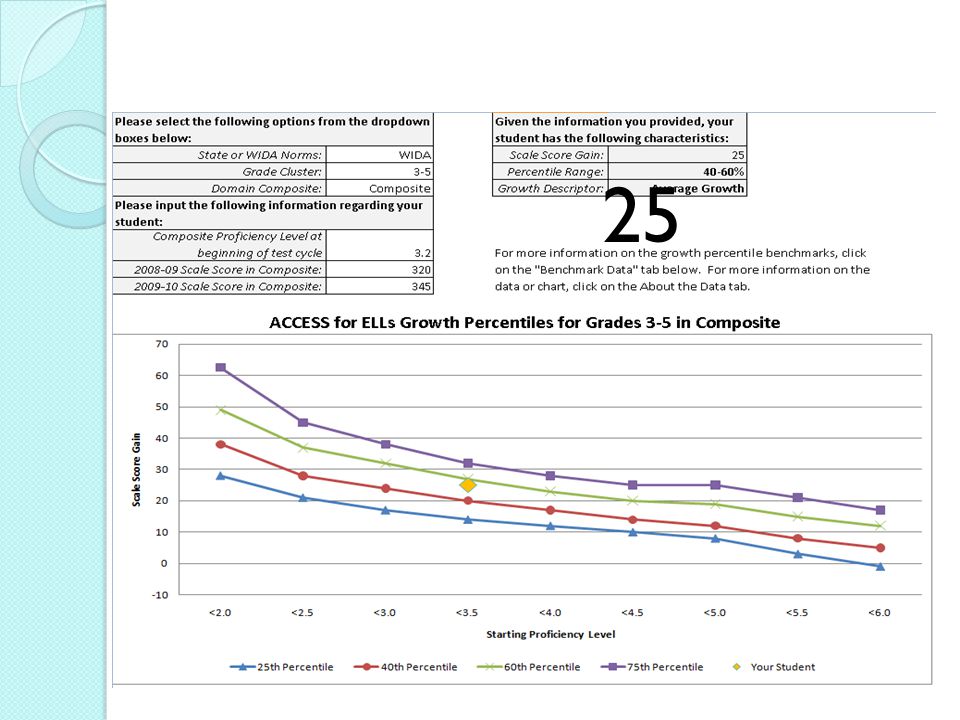
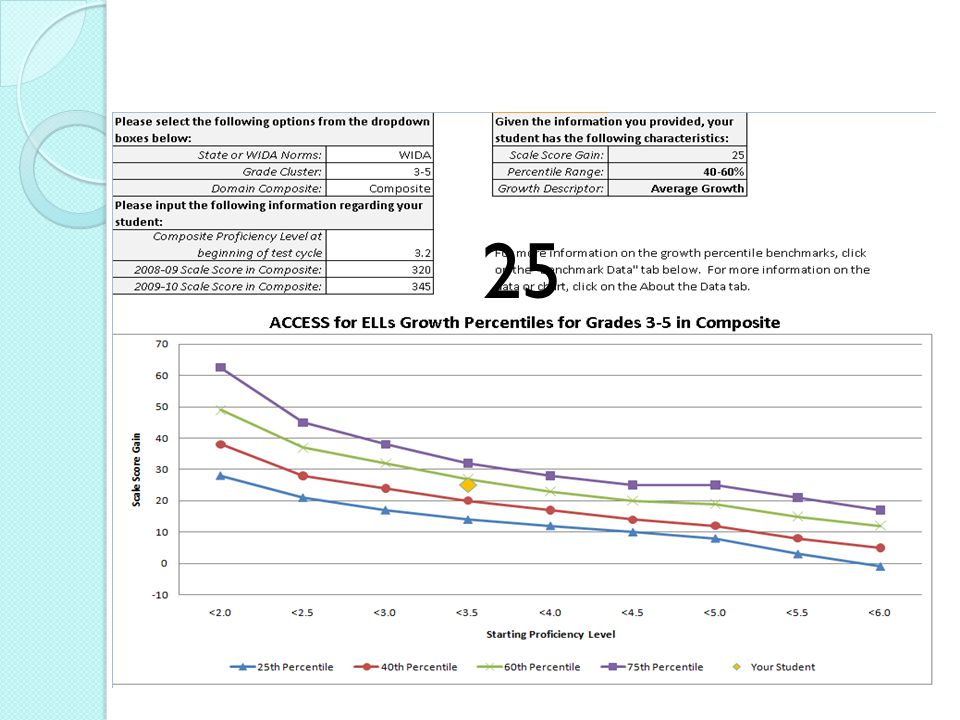
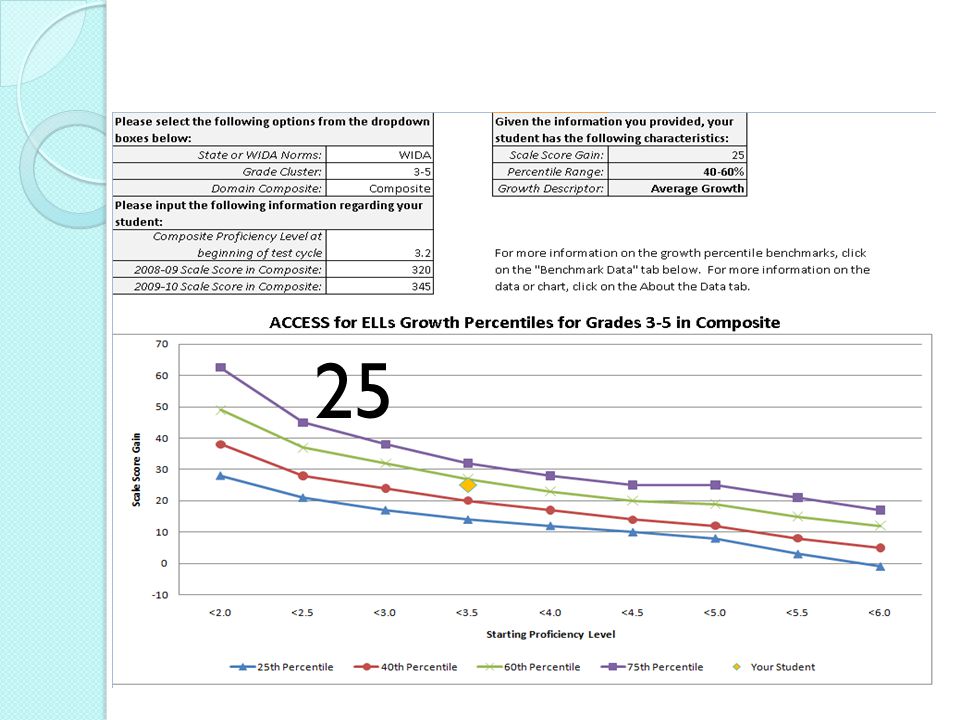
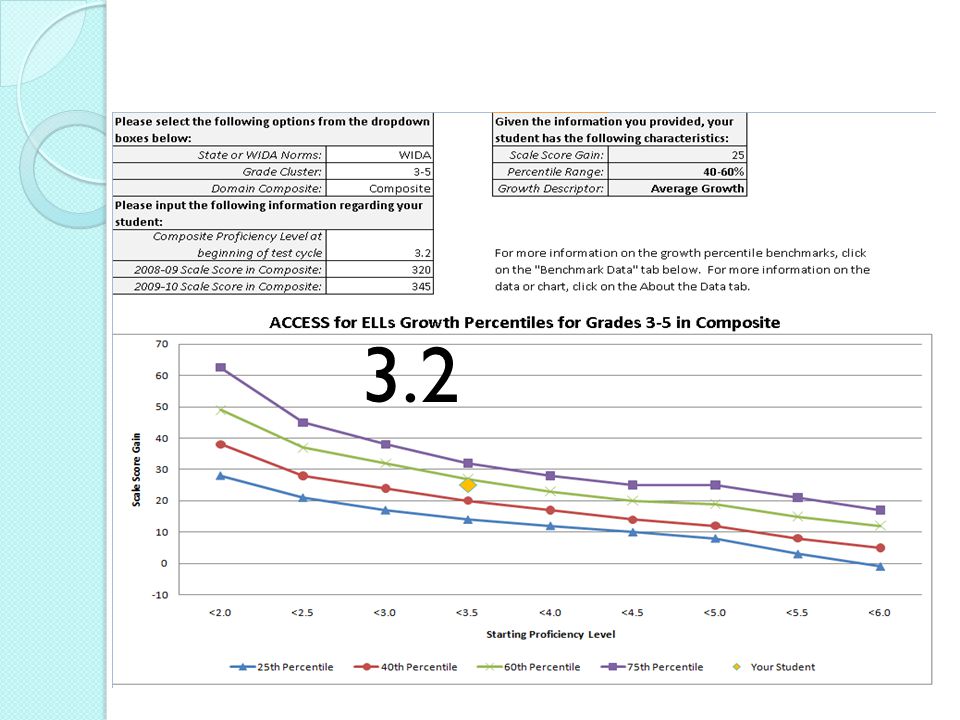
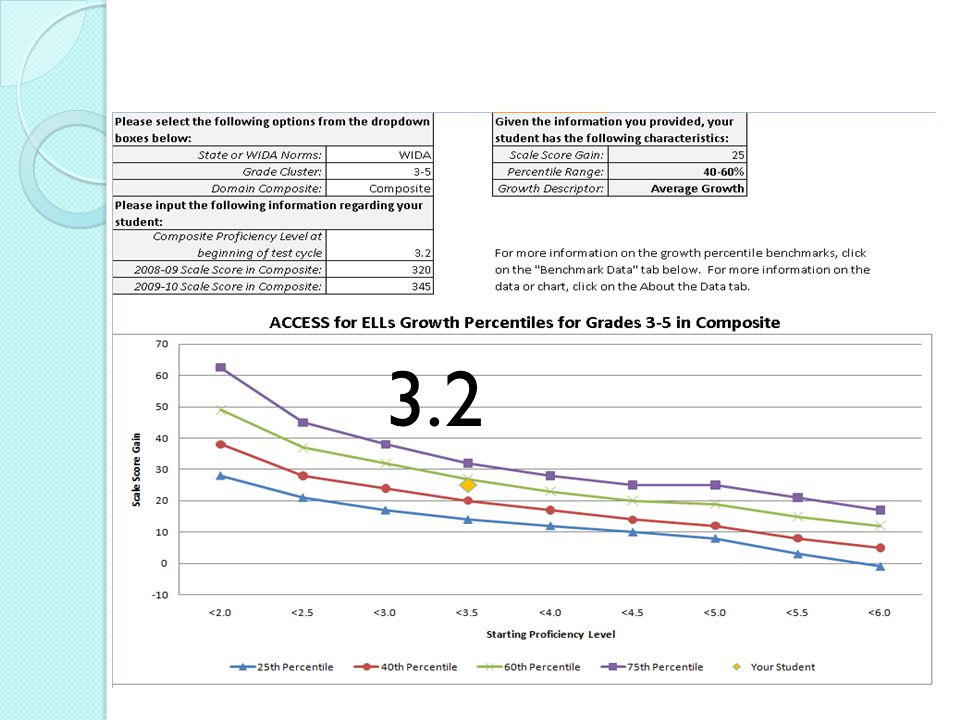
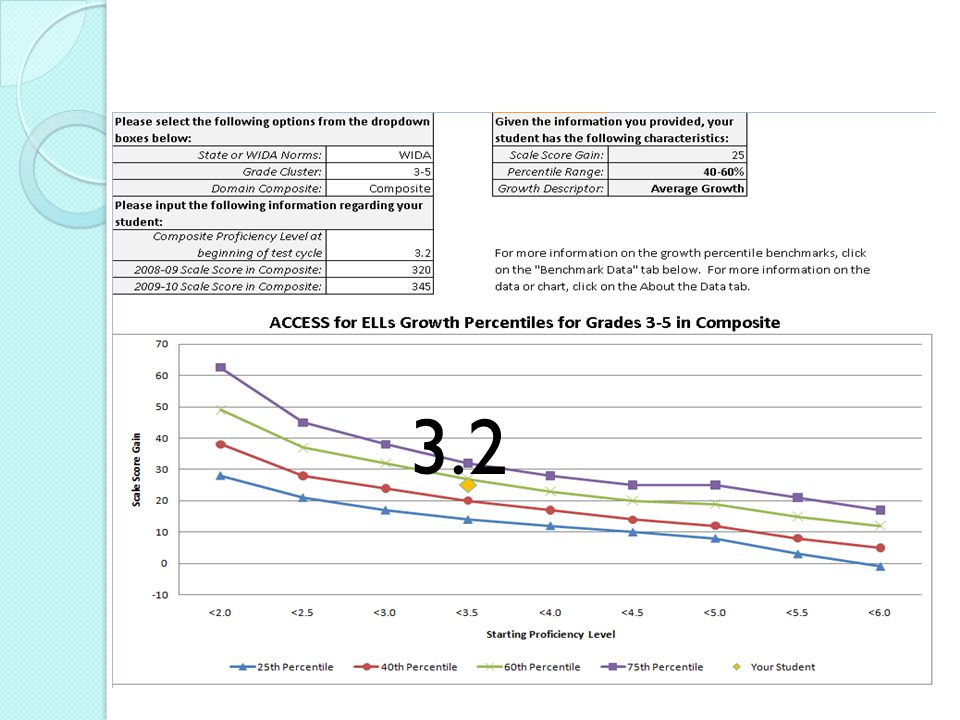
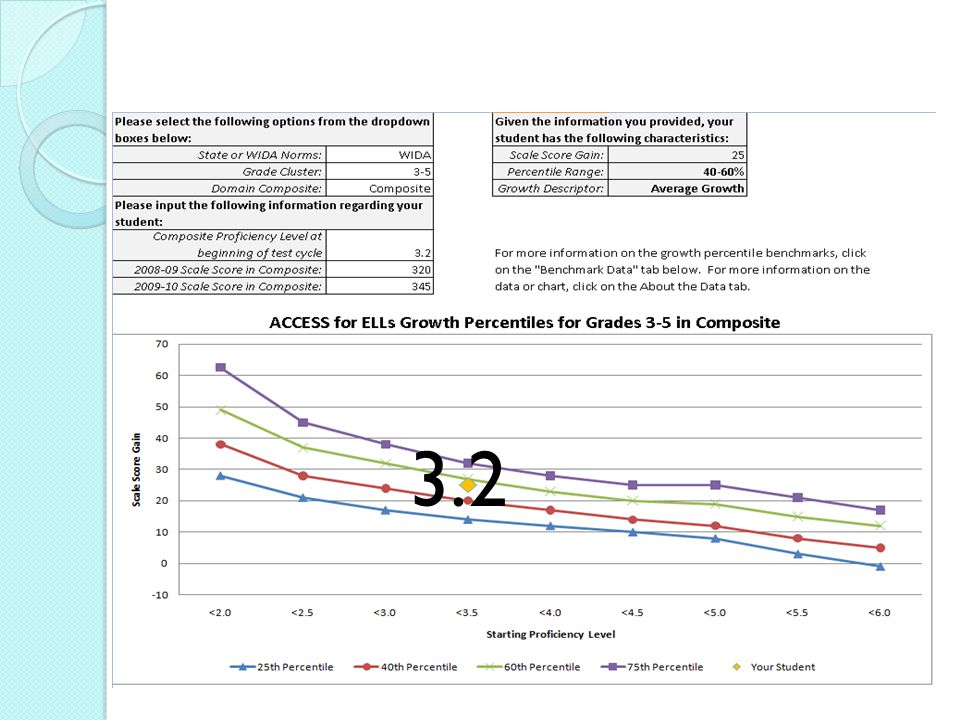
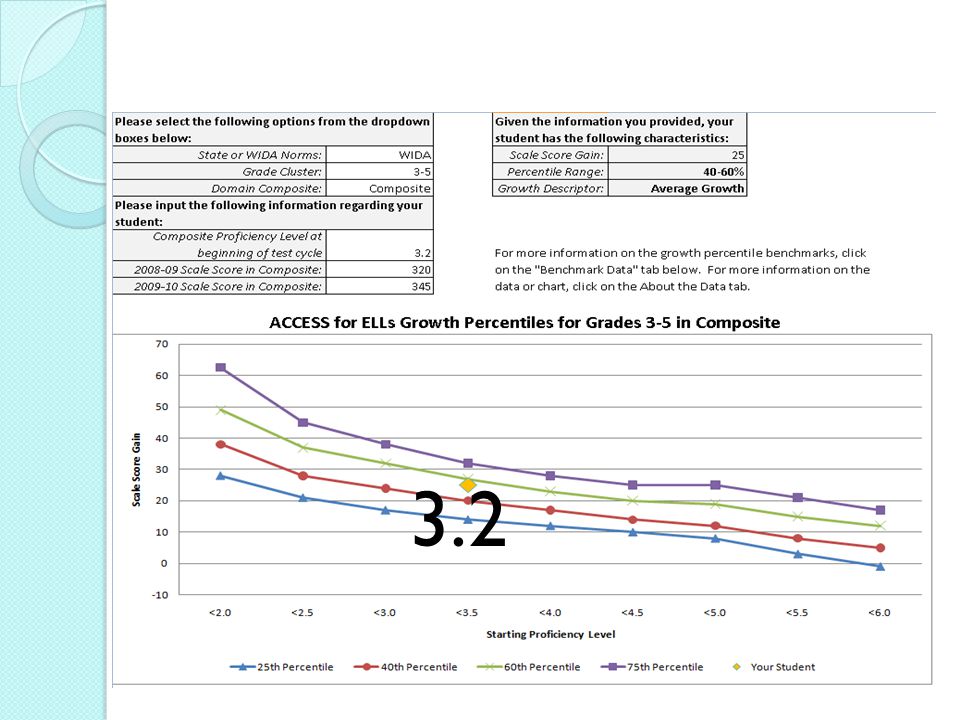
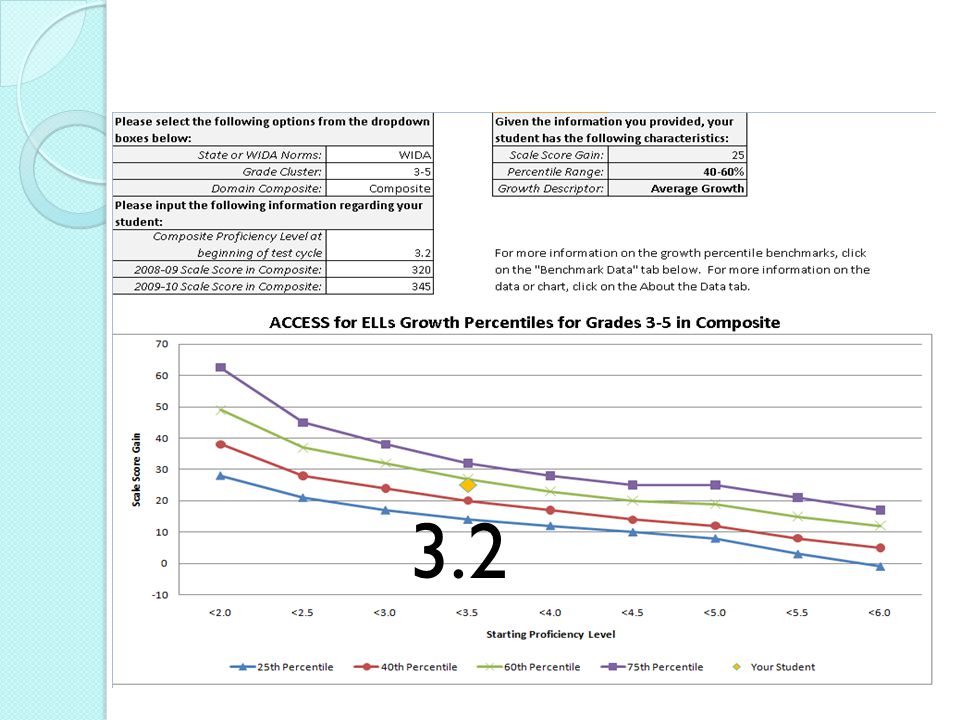
Step 2) Input Sam’s Test Data Sam had an Overall Composite Proficiency Level of 3.2 in the first year of the test cycle. Sam had an Overall Composite Scale score of 320 in the first year of the test cycle (Fall 2008.) Sam had an Overall Composite Scale score of 345 in the second year of the test cycle (Fall 2009.)
 Sam had an Overall Composite Scale score of 345 in the second year of the test cycle (Fall 2009.).")
19
Step 3) Let GREAT work its magic The following animation will show you how GREAT operates! Press ENTER to continue

25
25

42
3.2

57
25

58
3.2 25

59
3.2 25

60
3.2 25

61
3.2 25

62
3.2 25

63
3.2 25

64
3.2 25

65
3.2 25

66
3.2 25

67
3.2 25

68
3.2 25

69
Step 4) Interpret Sam’s Growth Data Sam’s achievement on the ACCESS for ELLs Assessment puts him in the 40 th to 60 th percentile range. Sam displayed average growth compared to all WIDA students in the 3-5 grade cluster and a starting proficiency level <3.5.

70
Step 4) Interpret Sam’s Growth Data PLEASE NOTE: The X-Axis is NOT a measure of time! It is a measure of a student’s starting proficiency level. On this chart, scale score gain is measured as a function of proficiency level, NOT time.

71
Step 5) Develop a Plan of Action Is Sam’s level of growth appropriate for a student at his level? Is there anything Ms. Webster can do to improve Sam’s rate of English Language acquisition? What are the best steps to take to support Sam’s English Language Development?

72
A Note About the Data Currently, GREAT allows educators to view student growth for the following years: ◦ Using Wisconsin as the norm group: 2010- 11 to 2011-12 school years. ◦ Using the WIDA Consortium as the norm group: 2010-11 to 2011-12 school years. ◦ Additional years of data will be added as soon as it is made available.

73
Disclaimers This tool should be used only as a component of a larger system of analysis, rather than the sole criteria by which students are measured and should be used in combination with other indicators of student achievement. The data used within this tool links to scale scores. Scale scores can be used to observe a student’s growth over time within (not across) language domains or composites. For instance, an Oral Language composite scale score cannot be compared to a Comprehension composite scale score. Language proficiency gains are not always linear. Students will not necessarily make same type of gains from year to year. It’s best to look at students’ growth over multiple testing cycles using a variety of indicators.
 language domains or composites. For instance, an Oral Language composite scale score cannot be compared to a Comprehension composite scale score. Language proficiency gains are not always linear. Students will not necessarily make same type of gains from year to year. It’s best to look at students’ growth over multiple testing cycles using a variety of indicators..")
74
Contact Us Office of Student Assessment (608)267-1072 Oeamail@dpi.wi.gov
")
Similar presentations


![Enquiring mines wanna no.... Who is it? Coleman Report “[S]chools bring little influence to bear upon a child’s achievement that is independent of.](/15/4758624/big_thumb.jpg "Enquiring mines wanna no.... Who is it? Coleman Report “[S]chools bring little influence to bear upon a child’s achievement that is independent of.>")


