Download presentation
Presentation is loading. Please wait.

1
aaaaa

2
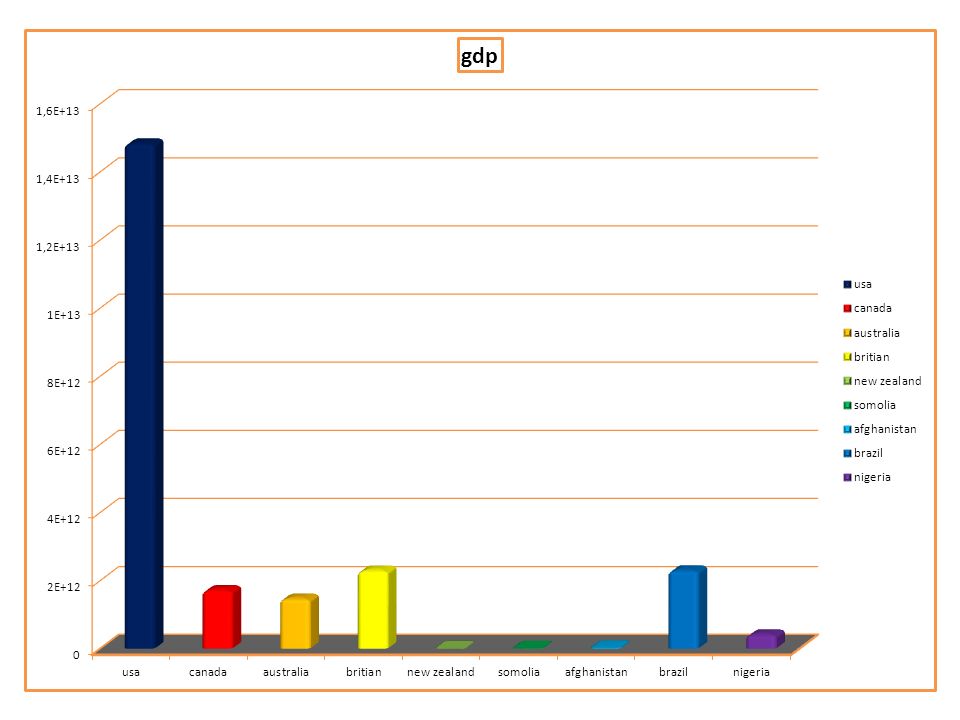
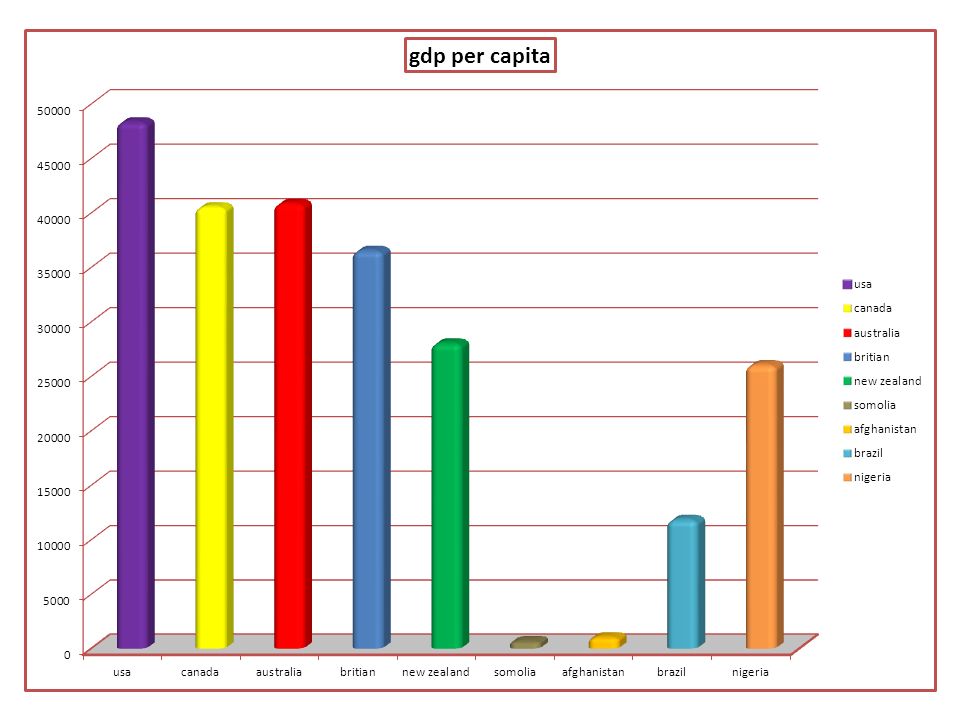
In the chart America has the highest graph because America is very rich causing more people to move to America in search of a better life or a job. I think new Zealand has the lowest graph because there is a lower gdp than most countries and it is hard to move to. The two graphs before the last two graphs are where they are because they have a very low gdp and are either in a conflict or are usually lead by local war groups like the Taliban and the samolina pirates. The last two graphs are developing countries they can improve their current state by earning more money and educating their people. The country that stands out to me is new Zealand because it has a low gdp and a low population but a high gdp per capita wouldn't that cause more people to move there.

4
In the chart America has the highest graph because American people are more confident in their life like expecting to go to college and owning a house witch in turn causes them to work harder and they are more educated than developing countries. I think Somalia has the lowest gdp because they are not very educated and they are very controlled by Somalian pirates. The two graphs before the last two graphs are where they are at because their people are not very educated and are put down by bad people. The last two graphs are where they are at because they have a better abundance of natural resources and it attracts more people from the local area but they can have a even better economy by improving their education standards. The country that really stands out to me is canada although it is in a wealthy area its gdp is lower than brazil

6
America has the highest graph because American are highly educated and have a lot of hard workers. Somalia has the lowest gdp because its people are put down and have a bad education. The two graphs before the last two graphs are where they are currently because their people are put down and are poorly educated. The last two graphs are at where they are at currently because a better education and better economy attract people from the area they could have a better economy by educating their people even more and attracting more people to their area. The country that stands out to me is Nigeria because they have a much lower gdp than brazil but a much higher gdp per capita than brazil.

Similar presentations


. What country has the largest column? What are the reasons that you think that this country.>")


